
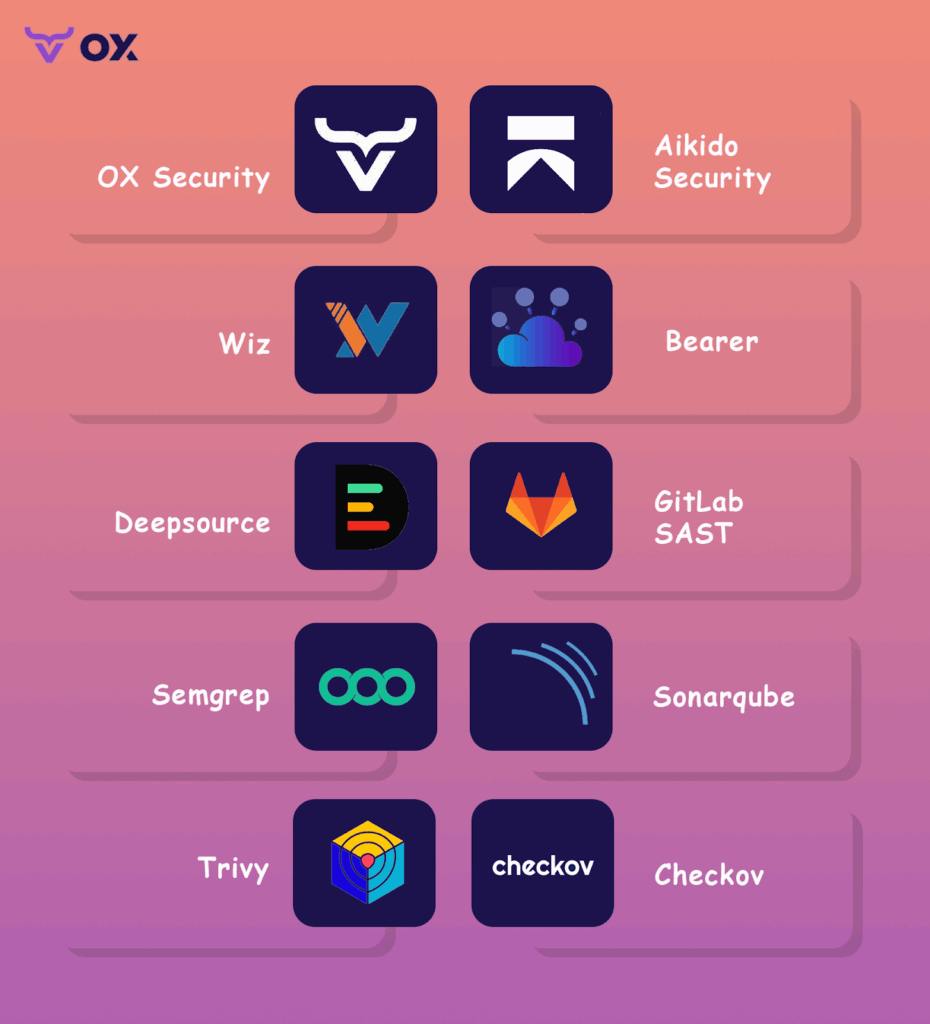
TL;DR:
- OX Security covers the full application lifecycle, from AI-generated code through pipelines, cloud, and runtime, in a single unified platform. Ideal for teams that need end-to-end visibility beyond code and dependency scanning.
- Aikido Security is developer-friendly, with a focus on clear risk triage and noise reduction, perfect for teams needing fast onboarding and actionable feedback.
- Wiz excels in cloud-native security, providing deep runtime visibility and IAM risk detection, best for cloud-heavy teams.
- GitLab integrates security directly into CI/CD, making it great for GitLab users who need security scanning in their development pipeline.
- Trivy is a fast, open-source scanner that covers containers, IaC, and Kubernetes, suitable for teams needing lightweight, no-frills security checks.
Application security today goes far beyond static code analysis. In modern environments, we’re not just securing code; we’re securing pipelines, infrastructure, and runtime environments. What matters most is end-to-end visibility across the entire SDLC: tracking risks from the first commit to production, including IaC misconfigurations, third-party dependencies, vulnerable containers, pipeline integrity, and cloud runtime exposure.
The challenge is scale. In most organizations, we’re running hundreds of microservices, integrating with third-party APIs, and deploying thousands of containers across multiple cloud providers. A single missed configuration or leaked secret can propagate into production in minutes. By the time you detect it, you’re often dealing with exposure across multiple environments.

The IBM 2025 Cost of a Data Breach Report makes this painfully clear: the average cost of a breach is now USD 4.44 million globally, and over USD 10.2 million in the U.S. Supply chain compromises alone account for 15% of breaches and are among the hardest to detect, often taking six to nine months before discovery. Meanwhile, IAM privilege drift and misconfigurations remain major enablers of lateral movement in cloud-native architectures.
For AppSec, this means traditional SAST and SCA tools are no longer enough. We need platforms that can:
- Map attack paths across the SDLC, from source to container image to production workload.
- Prioritize vulnerabilities based on exploitability, asset exposure, and runtime context.
- Secure the CI/CD pipeline, validating every build, artifact, and deployment.
- Enforce software supply chain integrity with SBOM tracking and artifact provenance.
- Deliver audit-ready reporting for frameworks like SLSA, SSDF, and ISO 27001.
Snyk is effective for code and dependency scanning, but as development and production environments become more distributed and cloud-native, there are areas like pipeline security, runtime risk visibility, and compliance where additional tools may be needed.. That’s why we’ve put together this guide to evaluate the top 10 Snyk alternatives for 2026, focusing on platforms purpose-built for full-stack risk management in complex, dynamic environments.
When to Look For Snyk Alternatives
Snyk is widely adopted for dependency and code scanning early in development. As organizations scale, with more services, more pipelines, and tighter regulatory requirements, security objectives often expand as well.
Here are common scenarios where teams assess complementary capabilities or broader platforms:
To Achieve a Unified, Holistic Security Posture
Snyk is developer-first by design. That’s its strength, and its ceiling. It scans individual repos, containers, and IaC templates, but it doesn’t stitch together an enterprise-wide view of security across code, CI/CD, cloud accounts, and runtime environments.
As security shifts from isolated scanning to full-lifecycle risk visibility, this fragmentation becomes a liability. Mature teams need platforms that provide context across the SDLC: how a vulnerable package made it past CI, how it landed in a container, and whether that container is running in prod with network exposure and misconfigured IAM roles. Snyk doesn’t do that.
If you’re trying to align with NIST SSDF, SLSA, or even basic internal audit readiness, you’ll need unified coverage, that spans from code to cloud and ties all the moving parts together.
To Reduce False Positives and Minimize Alert Fatigue
One of the most common complaints about Snyk is alert noise. It flags issues without determining whether they are actually exploitable in your environment, such as whether the vulnerability can be triggered in your specific configuration or under your operational conditions. While this might be manageable for smaller teams, it becomes inefficient at scale.
Without a clear context on which vulnerabilities are actively reachable or could lead to significant risk, teams spend excessive time triaging issues that aren’t critical. Security engineers are drawn into countless CVE investigations that don’t address the actual risk, leading developers to eventually ignore the alerts.
One of the most common complaints about Snyk is alert noise. It flags issues without validating whether they’re exploitable in your actual environment. That might be acceptable in early-stage teams, but it quickly breaks down at scale.
Without an exploitability context or reachability analysis, teams waste hours triaging low-priority vulnerabilities. Security engineers are pulled into endless CVE fire drills that don’t address actual risk. Developers start ignoring the alerts entirely.
Reddit threads reflect this fatigue clearly:
“Snyk is a solid tool, but I find it to be too noisy; there were too many FPs.”
“We switched to Aikido Security because it gave us real triage and visibility across issue types, not just raw volume.”
– r/cybersecurity
What appsec teams want isn’t more vulnerabilities; they want a signal. Platforms that include exploit-aware analysis, runtime context, and noise suppression are increasingly seen as the next step forward.
To Manage Cost at Scale
Snyk’s pricing model can get out of hand fast. It’s tied to the number of developers, projects, and integrations. As you grow, each new repo or dev seat adds incremental cost, without necessarily increasing security ROI.
For small teams, it’s manageable. For large teams with hundreds of repos and a broad surface area, costs can escalate quickly. And that cost doesn’t necessarily align with risk reduction.
Security leaders are seeking more predictable models that tie pricing to actual usage or value, such as the number of pipelines secured or artifacts scanned. Tools that unify scanning across domains also help consolidate costs by eliminating the need for separate SAST, SCA, and IaC tools.

Top 10 Snyk Alternatives (Tool by Tool)
1. OX Security
OX Security maps every code change, pipeline run, container build, and cloud deployment into a single connected security graph, so when a vulnerability surfaces in production, the fix starts at the exact line of code that introduced it. This allows a single issue to be tracked across its full execution path.
For example, if a vulnerable API is exposed in production, OX can trace it back to:
- the exact line of code where it was introduced
- the pull request and developer responsible for the change
- the CI/CD pipeline run that built and deployed it
- the cloud resource where it is currently exposed
Rather than emitting separate alerts at each stage, OX correlates code, pipeline, and runtime signals into a single finding, preserving the relationships between them. This gives teams a clear remediation path, fixing the originating change instead of addressing fragmented alerts across tools. Built around four core components:
- VibeSec: stops insecure code at the source, before it ever enters a repo.
- Code: connects every finding to exactly where in the codebase it lives and how it got there.
- Cloud: shows which cloud misconfigurations are actually reachable from your code.
- Agentic Pentester: acts like a continuous red team, constantly probing whether a risk can be exploited right now.
The result is high-fidelity, traceable findings, each issue tied to its origin, validated against real exposure, and resolved at the source.
Hands-on:
Once connected, the OX dashboard shows the full picture with GitHub repos, CI/CD pipelines like Jenkins and GitHub Actions, container registries, and AWS/GCP/Azure cloud deployments in one view as shown in the dashboard below:
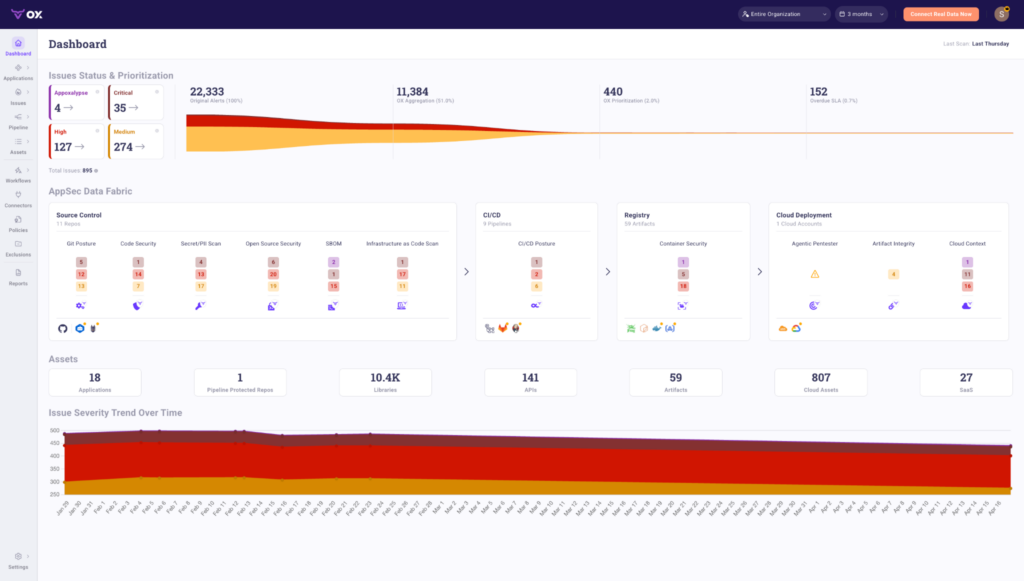
The top panel shows how OX reduces alert volume at each stage. In this example, 22,333 original alerts are aggregated down to 11,384 by OX’s correlation engine, then prioritized to just 440 actionable issues, with 152 flagged as overdue SLA. That’s 2% of the original alert volume reaching the remediation queue.
The AppSec Data Fabric below maps findings across four connected layers:
- Source Control: 11 repos scanned across Git posture, code security, secret/PII scanning, open source security, SBOM, and IaC. Each category shows findings by severity.
- CI/CD: 9 pipelines monitored for CI/CD posture issues across critical, high, and medium severities.
- Registry: 59 artifacts tracked for container security findings.
- Cloud Deployment: 1 cloud account covered across Agentic Pentester results, artifact integrity, and cloud context.
The Assets panel shows what OX has in scope: 18 applications, 10.4K libraries, 141 APIs, 59 artifacts, 807 cloud assets, and 27 SaaS integrations, all continuously monitored.
The Issue Severity Trend at the bottom tracks how risk changes over time, giving security and engineering teams a shared view of whether posture is improving or degrading across sprints.
Pros
- Unified security graph connects code, CI/CD pipelines, cloud infrastructure, and runtime in one place
- PBOM tracks every build input, dependency, and CI metadata across the pipeline in real time
- Agentic Pentester traces every finding to the exact repository, file, and commit
- Prioritization based on reachability, exploitability, and business impact
Cons
Limited interface functionality during scans
Setup takes time and requires connecting multiple systems
2. Aikido Security

Aikido Security is a lightweight but capable ASPM platform that emphasizes fast onboarding, developer-friendly UX, and clear risk triage. While it doesn’t offer the same extensive coverage of runtime security, attack-path mapping, or advanced cloud-native risk management as platforms like OX or Wiz, it covers the critical layers such as SAST, SCA, and IaC scanning, all packaged in a clean, responsive user interface. It’s designed for engineering-first teams that want security signals without drowning in noise.
Hands-on:
Aikido integrates with GitHub or GitLab in a couple of clicks. Once connected, it begins scanning code across repos for known vulnerability patterns, insecure coding practices, supply chain issues, and misconfigured GitHub Actions.
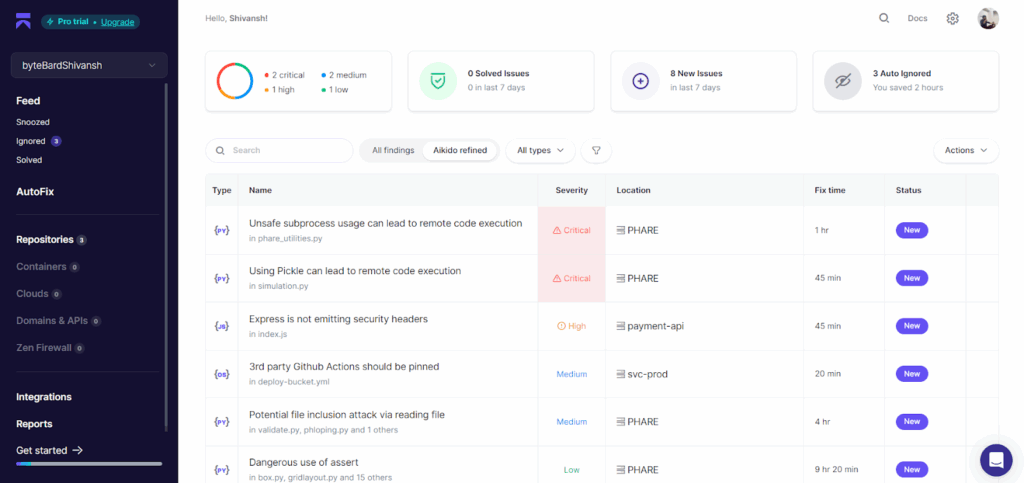
In the screenshot above, three repositories are integrated, and the dashboard surfaces 8 new issues in the last 7 days. Aikido automatically tags and prioritizes findings, breaking them down by severity. Here, we see 2 critical, 1 high, 2 medium, and 1 low severity issues.
What stands out is how readable the interface is. Each finding includes the file path (e.g., phare_utilities.py, simulation.py, etc.), a severity label, estimated fix time, and a status tag. For instance:
- Unsafe use of subprocess flagged as a Critical RCE risk
- Use of pickle in Python flagged due to known deserialization risks
- GitHub Actions missing pinning in workflows
- Express app missing security headers in index.js
Each issue is grouped by type, Python, JavaScript, and YAML, and scoped to a specific repo. You also get a running tally of auto-ignored issues (in this case, 3), showing time saved via automated triage rules. The platform applies filters like “Aikido refined” to cut through false positives and only surface items that have a real impact.
Estimated fix times (ranging from 20 minutes to 9+ hours) give teams a useful baseline for planning sprints or backlog prioritization. It’s not just about detection; it’s about making the data usable.
Pros
- Very fast setup, clean UI, and excellent onboarding experience
- Filters noise effectively with refined triage logic
- Ideal for engineering teams that want clarity without AppSec overhead
- Supports SAST, SCA, GitHub Actions security, and IaC basics
Cons
- Not yet enterprise-mature (limited in compliance tooling or board-level reporting)
- No runtime visibility, CSPM, or advanced attack-path modeling
- Some security teams may want more customization around policies or enforcement
3. Wiz
Wiz is a leader in the Cloud-Native Application Protection Platform (CNAPP) space, with deep visibility into cloud workloads, identity, containers, and runtime risk. Unlike code-first tools, Wiz takes a cloud-infrastructure-first approach. It ingests configuration, entitlement, and runtime data from cloud providers (AWS, GCP, Azure), then correlates it with vulnerabilities, exposed secrets, and lateral movement paths to build attack graphs. If you’re running production in the cloud and need context-aware visibility across services, Wiz is one of the most complete solutions out there.
Hands-on:
Once Wiz is connected to your cloud provider via read-only access, it performs a full environment scan, including VMs, storage buckets, IAM roles, public endpoints, and data layers. In the screenshot below, we’re viewing the Data Security dashboard:
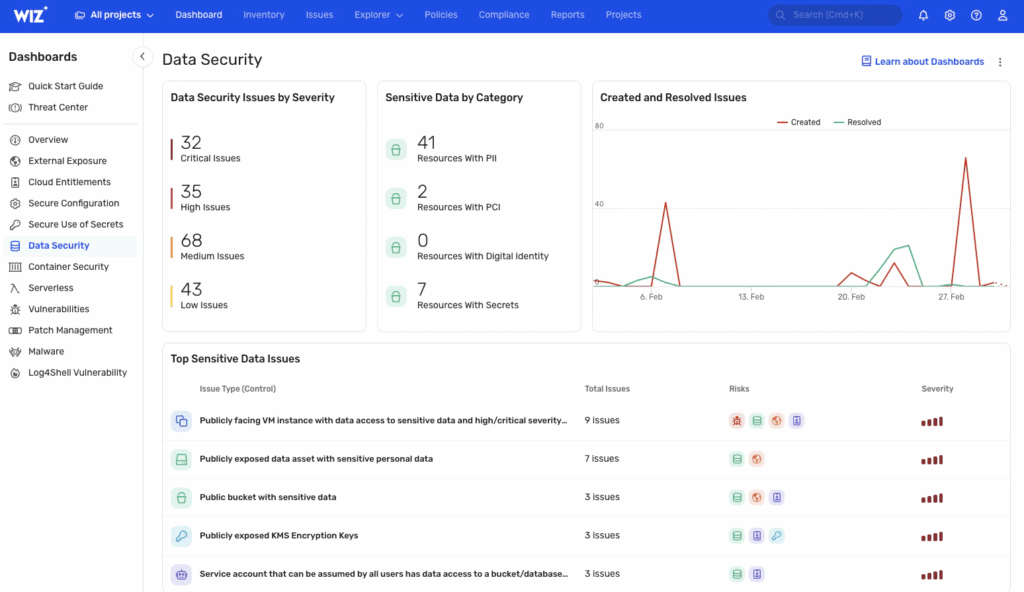
Wiz breaks down issues by severity. Here, there are 32 critical, 35 high, and 68 medium findings, grouped under categories like PII exposure, misconfigured access, or publicly exposed encryption keys. It flags risks like:
- VMs with public exposure and access to sensitive data
- Open S3 buckets with PII
- Unpinned service accounts with broad access
- KMS encryption keys exposed publicly
Each finding is risk-tagged with icons that indicate associated vulnerabilities, overly-permissive access, lateral movement paths, or privilege escalation vectors. This helps triage based not just on raw severity, but exploitability in your real cloud topology.
The right panel shows issue activity over time, new vs resolved issues, helping track risk remediation over weeks or sprints. On the left, the dashboard menu includes modules for external exposure, cloud entitlements, patch management, container security, and secrets hygiene. It’s not just a scanner; it’s a continuous cloud posture and runtime risk engine.
Pros
- Maps real attack paths by correlating cloud misconfigurations, secrets, identity, and vulnerabilities
- Excellent for runtime and post-deployment visibility
- Built-in support for compliance mapping (SOC 2, PCI, ISO, etc.)
- Scales well for multi-account, multi-cloud orgs
Cons
- Doesn’t plug deeply into Git-based workflows or early-stage dev pipelines
- Not a SAST/SCA platform, better paired with source-level tools
- Complex pricing model; full value typically realized at enterprise scale
4. GitLab

GitLab’s built-in DevSecOps suite provides out-of-the-box security scanning as part of its CI/CD workflows. With ultimate tier licensing, you get access to SAST, SCA (dependency scanning), secret detection, container scanning, and license compliance, all natively embedded within the platform. It’s especially effective for teams already standardizing their development and CI/CD on GitLab, removing the need for third-party integrations.
Hands-on:
Security scanning in GitLab is built directly into merge requests and the default pipeline. Once enabled, scans run automatically on the target branch, and findings are populated into the “Vulnerability Report” panel under “Security” and “Compliance”.
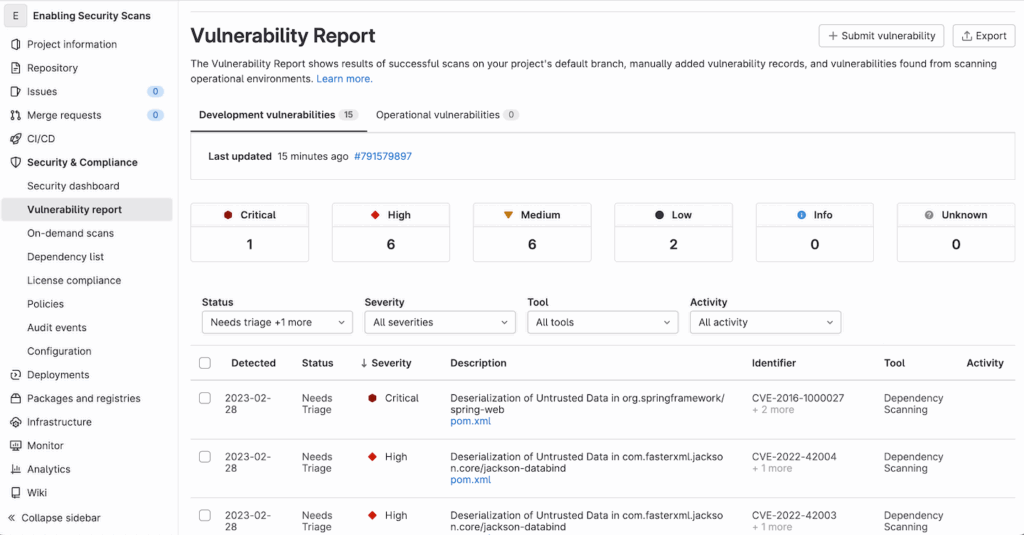
In the snapshot above, we see a project-level vulnerability report populated with 15 development vulnerabilities: 1 critical, 6 high, 6 medium, and 2 low. The critical issue here is a deserialization flaw in org.springframework:spring-web, flagged via dependency scanning and tied to CVE-2016-1000027. Similarly, other high-severity issues are related to known risks in jackson-databind, a common Java library.
The report interface includes filters by severity, tool, and activity. It also tracks whether findings are new, dismissed, or confirmed, and lets you export results or submit new vulnerability records manually. Most of the vulnerabilities shown are detected via SCA, though SAST results appear similarly if enabled in .gitlab-ci.yml.
One advantage here is that vulnerabilities are tied to specific files (e.g., pom.xml) and displayed inline in merge requests, making it easy for developers to act without leaving the GitLab interface.
Pros
- Natively integrated into GitLab CI/CD with no third-party wiring needed
- Good enough coverage for many teams, especially for JavaScript, Python, and Java
- Tight developer feedback loop via merge request scanning and MR blocking
- Easy policy enforcement for approvals and scan gating
Cons
- Security scanning is relatively basic, with limited exploitability analysis or prioritization logic
- Not extensible for more advanced use cases or custom policies
- No runtime visibility or supply chain risk modeling
5. Bearer
Bearer is a static analysis tool focused on security and privacy issues in code, especially how sensitive data like PII flows through your application. It’s built to catch risky patterns around things like insecure input handling, secret exposure, and privacy violations. It runs locally or in CI, no fancy setup needed.
Hands-on:
You install it via CLI, run bearer scan, and it gets to work. It loads a set of predefined rules, builds an abstract syntax tree of your code, and runs dataflow checks. In the example below, Bearer scanned a JavaScript project with 271 files and flagged a high-severity issue: unsanitized input being passed into innerHTML, classic XSS. It points straight to the line in index.ts, with rule context and CWE reference included.

The output is plain-text and clean. It tells you what’s wrong, why it matters, and where to fix it. You can ignore findings with a command if needed. No guessing, no noise.
What makes Bearer useful is that it doesn’t just grep for patterns; it follows data from source to sink. So it’ll only flag issues if user input is actually reaching something risky like eval, HTML insertion, or insecure storage, and without proper checks in place. That keeps the false positives low and the signal high.
Pros
- Simple to run, fast results
- Tracks real data paths through your code
- Helpful for spotting XSS, secret exposure, or bad crypto use
- Works well in local dev or GitHub Actions pipelines
Cons
- No web UI or dashboards
- Doesn’t cover containers, cloud, or CI/CD posture
- Requires some familiarity with CLI tools and how your code handles data
6. DeepSource
DeepSource is a developer-focused static analysis platform that blends code quality and security. It’s designed to flag real issues that actually matter in day-to-day development, things like unsafe function usage, unvalidated input, hardcoded secrets, and risky third-party library calls. It supports a growing number of languages and integrates directly into GitHub or GitLab repos.
Hands-on:
Once connected to a repo, DeepSource starts analyzing every commit and PR for security issues, bug risks, performance problems, and even coding style violations. Findings are shown right inside the web dashboard with full file context and rule metadata.
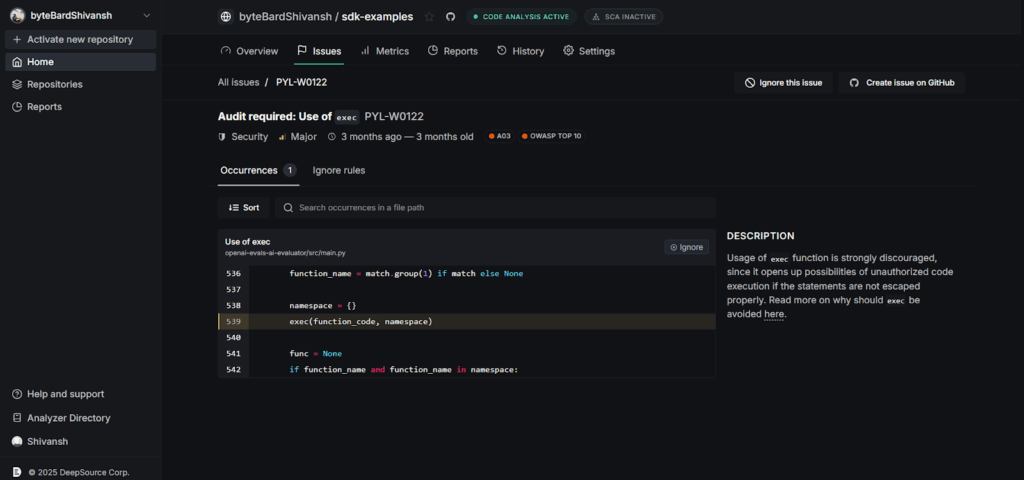
In the screenshot above, DeepSource flagged the use of Python’s exec() function in main.py. It marks this as a major security issue because of the potential for remote code execution, especially when exec() is used with untrusted input. The UI clearly shows the line of code, the rule triggered (PYL-W0122), and includes references to OWASP Top 10 and CWE mappings.
Each issue comes with an explanation on why it’s dangerous and how to fix or suppress it. You can sort issues, mark them as ignored, or raise a GitHub issue directly from the interface. The feedback loop is short and actionable, something security tools often miss.
Pros
- Developer-friendly interface and fast feedback
- Covers both security and general code quality
- Suggests refactors with real fixes, not just warnings
- Tight GitHub integration with inline PR annotations
Cons
- Limited to the code layer, no IaC, container, or runtime scanning
- Coverage is still growing; some enterprise languages and frameworks may be missing
- Doesn’t handle compliance reporting or attack surface correlation
7. Semgrep
Semgrep is a fast, lightweight static analysis tool with a strong focus on customizability. It’s widely used by security and platform teams that want more control over what gets flagged and how. You can write your own rules, plug it into CI/CD, and get near real-time results. It supports a broad range of languages and is especially good at finding security bugs early in the dev cycle.
Hands-on:
Semgrep can run locally, in CI pipelines, or through Semgrep Cloud. Once connected to your repo, it scans pull requests and branches for patterns defined in its rule sets. You can use existing community rules, tweak them, or write your own.
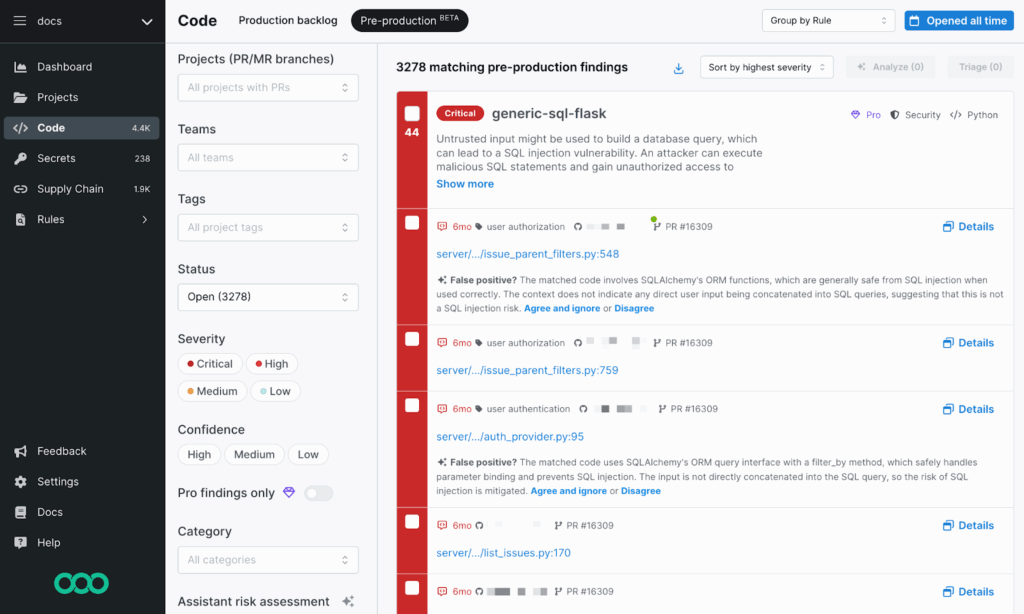
In the snapshot above, Semgrep is running across a Python codebase and has flagged a critical SQL injection risk (generic-sql-flask). It’s a warning that untrusted input might be used to build a database query. But it also provides context, highlighting that SQLAlchemy ORM is being used safely here, and this might be a false positive.
This level of context is important. You can review the match, get an explanation, and decide whether to triage or suppress it. Semgrep doesn’t just dump alerts; it encourages review with reasoning and links to the rule logic behind each hit.
Filters on the left let you narrow down by severity, confidence level, project tag, and issue category. In larger environments, this makes triage much faster. The interface is actionable and integrates directly into GitHub/GitLab pipelines, allowing users to execute actions directly from the platform.
Pros
- Fast scans and highly-customizable rule engine
- Good community support and open rule libraries
- Clear match feedback makes it easy to triage or tune
- Works well in PR workflows with inline annotations
Cons
- Writing custom rules takes some learning
- Coverage gaps if you don’t tune the rules properly
- Not built for runtime or cloud scanning, it’s a code-only tool
8. Sonarqube

SonarQube is a code quality and static analysis platform that helps teams catch bugs, security issues, and technical debt across a wide range of languages. It’s especially useful for teams maintaining large or legacy codebases and wanting visibility into maintainability and reliability metrics, alongside basic security scanning.
Hands-on:
Once SonarQube is set up, either self-hosted or on SonarCloud, it scans your repositories and provides a dashboard with scores across security, reliability, maintainability, and code duplication. You get a clean view per project, with pass/fail status based on the defined quality gate.
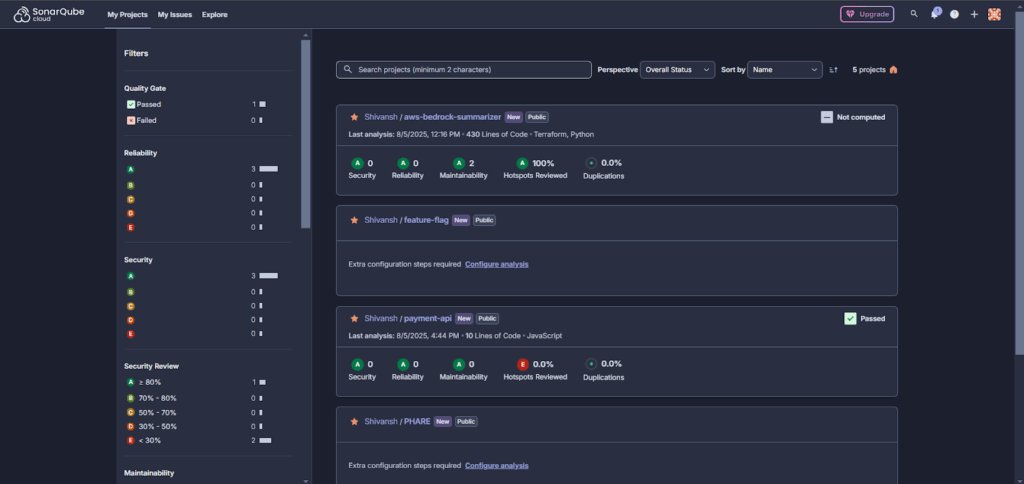
In the screenshot above, multiple projects are shown with security and quality metrics. For example, the aws-bedrock-summarizer repo (written in Python and Terraform) has a perfect score: all A grades across the board, 100% of security hotspots reviewed, and no code duplication.
SonarQube also shows filterable breakdowns by project, status, and severity. You can sort by overall score, dive into specific issues, or configure extra analysis steps if setup is incomplete. It flags missing coverage or incomplete hotspot reviews clearly, like the payment-api project, where the Hotspots Reviewed score is still at 0%. The UI is straightforward, good for managers and developers alike, and it gives a bird’s-eye view into code health across all repos.
Pros
- Strong language support (Java, JS, Python, C#, PHP, more)
- Great for spotting tech debt and code quality issues.
- Works well in CI/CD and self-hosted setups
- Integrates with GitHub/GitLab/Maven/Jenkins/etc.
Cons
- Security coverage is shallow compared to modern SAST tools
- No cloud, IaC, or runtime support
- Setup can be complex for larger orgs or multi-repo projects
- Needs external test tools for coverage metrics
9. Trivy
Trivy is a fast, no-nonsense open-source security scanner built by Aqua Security. It covers container images, file systems, Git repos, Kubernetes clusters, and IaC configs (like Terraform and Dockerfiles). Out of the box, it detects vulnerabilities, misconfigurations, exposed secrets, and license issues. It’s CLI-first, easy to use, and works well in CI pipelines or locally during dev.
Hands-on:
Trivy is a single binary, no agent, no external DB needed. You just install it and start scanning. Example for scanning a Kubernetes cluster:
trivy k8s --report summary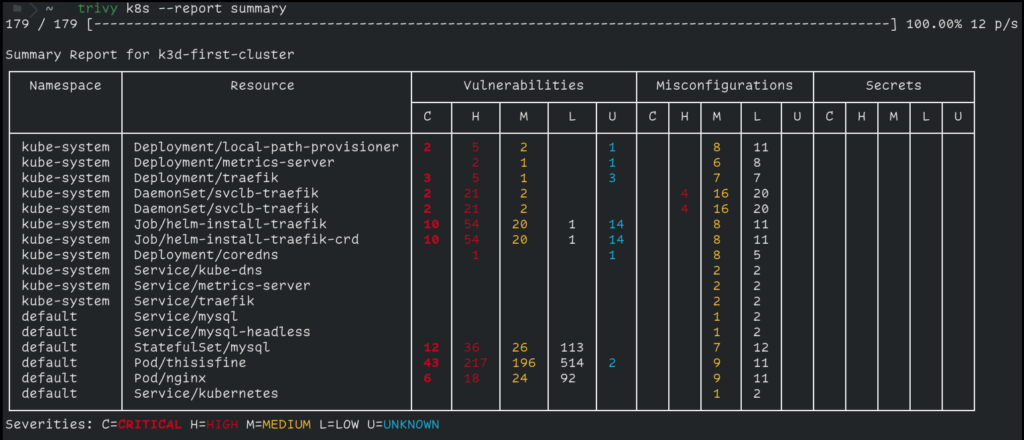
In the screenshot above, we ran a scan on a kubernetes cluster. It picked up critical and high-severity issues in several pods, including unpatched vulnerabilities in nginx and mysql, and misconfigurations in traefik. There were no exposed secrets here, but Trivy would flag them if found (e.g., AWS keys in env vars).
You can also scan:
- Container images: trivy image nginx:latest
- Local directories: trivy fs .
- Terraform/Dockerfile/IaC configs: trivy config .
- Git repos directly: trivy repo https://github.com/user/project.git
Trivy supports filtering by severity and exporting results in formats like JSON, table, or SARIF. It also has a plugin system if you want to build custom checks.
Pros
- Extremely fast with no external dependencies
- Covers multiple targets (images, code, IaC, clusters)
- Clear CLI output and CI-friendly
- Works offline
- Good defaults, scans for vulnerabilities, misconfigurations, and secrets automatically
Cons
- No built-in UI or dashboard (you’ll need to export results or use Trivy Operator for that)
- Doesn’t provide fix recommendations, just points to what’s wrong
- Doesn’t do live enforcement or runtime detection
- Output can get noisy unless filtered
10. Checkov
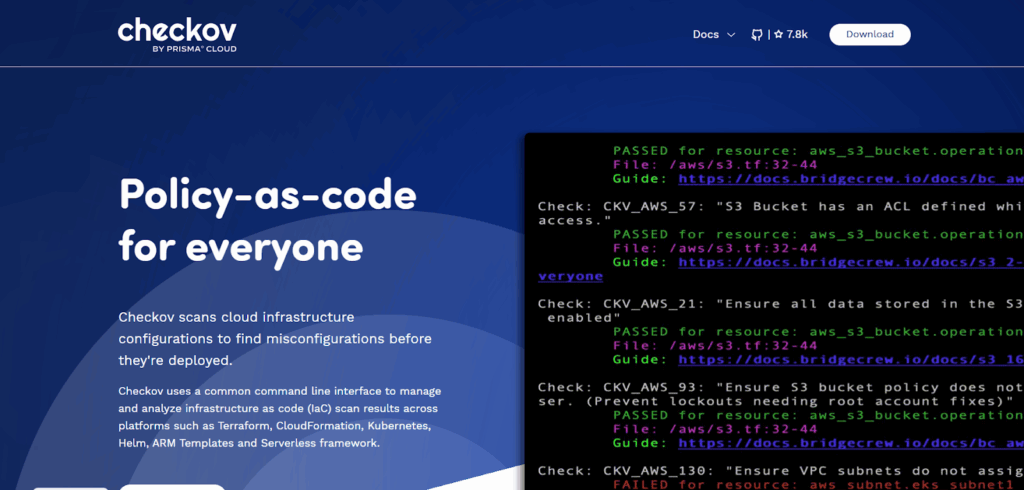
Checkov is a command-line tool for scanning Infrastructure as Code (IaC). It catches misconfigurations in Terraform, CloudFormation, Kubernetes manifests, Dockerfiles, Helm charts, and a few others. It’s built to help you catch bad defaults and insecure settings before you apply them. It comes with hundreds of built-in checks mapped to real policies like CIS benchmarks, SOC2, PCI DSS, and NIST.
It’s a go-to tool if you’re working with Terraform and need something that fits into a pipeline or pre-commit hook.
Hands-on:
Install it with pip:
pip install checkov
Then run it against a Terraform directory:
checkov -d ./terraform/
Or scan a single file:
checkov -f main.tf
Checkov will scan every resource in your IaC and compare it against its built-in policy engine. The output shows which checks passed or failed, which file and line they came from, and a short reason why. For example, in the snapshot below:
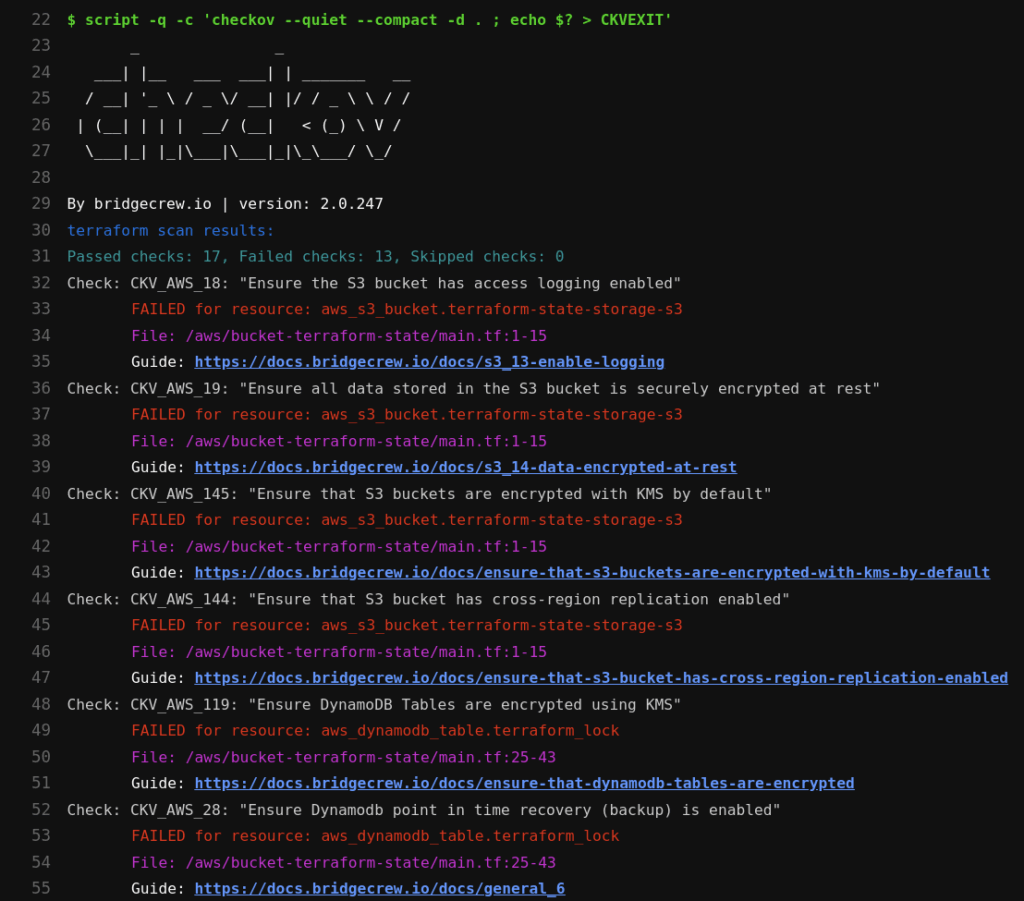
It scanned a Terraform configuration for S3 and DynamoDB resources. It flagged several high-risk issues:
- S3 buckets missing access logging (CKV_AWS_18)
- No encryption at rest (CKV_AWS_19)
- Missing KMS encryption (CKV_AWS_145)
- No cross-region replication (CKV_AWS_144)
- DynamoDB tables missing KMS encryption and point-in-time recovery (CKV_AWS_119, CKV_AWS_28)
Each failed check includes:
- Check ID and policy name
- The affected resource and file
- A direct link to Bridgecrew’s docs explaining how to fix it
You can export results in JSON/SARIF for use in CI/CD, or combine it with pre-commit hooks to stop insecure code from merging.
Pros
- Easy to install and run locally or in CI
- Solid coverage for Terraform, CloudFormation, Helm, Kubernetes, etc.
- Maps to real standards like CIS, PCI, and NIST
- Output is clean and tells you exactly what and where the problem is
- Supports custom rules if you want to enforce internal policies
Cons
- Only scans IaC, doesn’t handle containers or app code
- Custom rule creation requires some familiarity with YAML or Python
Strategic Decision Framework for CISOs
In earlier sections, we looked at how individual tools perform on their own. But CISOs don’t buy tools in isolation. They buy outcomes. The goal is to reduce real risk, align with compliance requirements, and fit cleanly into engineering workflows, without creating friction or shelfware.
This section is built for security leaders trying to cut through vendor noise and map tools directly to operational needs. Whether you’re dealing with board-level compliance pressure, cross-team visibility gaps, or tooling bloat, these decisions need to align with the business, not just the tech stack.
Here’s how to think about it.
Application and Cloud Security Needs Mapped to Recommended Tools
| Strategic Requirement | Recommended Tools | Why These Fit |
| Full-lifecycle risk visibility, code, pipelines, cloud, and runtime connected | OX Security | OX maps GitHub repos, CI/CD pipelines, container registries, and AWS/GCP/Azure deployments into a single security graph. A vulnerability in production traces back to the exact line of code, pull request, and pipeline run that introduced it. |
| Cloud-native risk + runtime detection | Wiz, Check Point CloudGuard, OX Security | Built for live cloud environments. These tools detect real-time misconfigurations, public exposure, IAM drift, and lateral movement risks inside AWS, GCP, or Azure. |
| Dev-native security integrated in CI/CD | GitLab, Semgrep, DeepSource | All three work inside merge requests or pipelines. Developers get immediate, contextual feedback without leaving their flow. Great for shift-left security without pushback. |
| OSS dependency & image scanning | Trivy, Snyk, Aikido, OX Security | These tools scan containers and open source libraries for known CVEs. They integrate with CI and registries, allowing you to catch vulnerabilities before deployment. |
| IaC policy compliance (SLSA, NIST SSDF, etc.) | Checkov, OX Security, Semgrep | These help enforce IaC best practices (Terraform, CloudFormation, Kubernetes YAMLs) with policy-as-code,essential for cloud compliance baselines. |
| Code quality and multi-language scanning | SonarQube, DeepSource | These tools don’t just catch security bugs; they also improve maintainability, reduce tech debt, and help developers write better code across stacks. |
This decision table isn’t about which tool is “best.” It’s about which tool best fits the job you’re solving for.
Compliance, SBOM & Supply Chain Alignment
Why This Matters to CISOs
Security isn’t just about coverage; it’s about proving control. That’s why CISOs care as much about auditability as they do about detection. And today, that’s nearly impossible without supply chain visibility.
Attacks like Log4Shell, SolarWinds, and the XZ backdoor proved that the real risk doesn’t always come from your code; it comes from your build pipeline, your open source dependencies, or the trust you place in third-party tools. These breaches weren’t zero days in code; they were blind spots in supply chain controls.
That’s pushed SBOM and secure build practices into the compliance spotlight. Frameworks like:
- NIST SSDF
- SLSA
- ISO 27001
- ENISA OSS Guidelines
- Executive Order 14028
…now expect teams to show traceability across all stages of development and deployment. That means tracking what packages you’re using, where they came from, who built them, how they were built, and what else is bundled with them.
And it’s not just static expectations. SBOMs are moving from checklist outputs to live security controls.
What to Look For in a Solution
If you’re responsible for aligning your security tooling with modern compliance and software supply chain guidance, the right tools should cover more than just dependency scanning.
Here’s what matters:
- Dynamic SBOM Support: Can the tool generate an SBOM at build time, track changes over time, and flag drifts between what was scanned vs. what was shipped? Static SBOMs are out; pipeline-aware SBOMs are the new baseline.
- CI/CD Awareness: Can the platform detect pipeline tampering, insecure runners, or build process risks? Does it monitor the actual flow from source to artifact?
- Third-party and OSS Tracking: It’s not enough to scan package.json or requirements.txt. The tool should track transitive dependencies, Docker image layers, and linked components from external registries.
- Audit-Ready Reports: You need to export data that maps directly to NIST SSDF, SLSA, ISO 27001, SOC 2, etc. Bonus points if it can show SBOM lineage tied to commits, builds, or deployments.
- Policy Enforcement: Can you enforce baseline requirements in code or pipeline (e.g., “all images must be signed,” or “Terraform must pass CIS checks”)?
In short, it’s not just about answering audit questions; it’s about having traceable, enforced controls across every layer of your SDLC.
When You Need OX Security Over a Standalone Code Scanner
OX Security maps every code change, pipeline run, container build, and cloud deployment into a single connected security graph, so when a vulnerability surfaces in production, the fix starts at the exact line of code that introduced it.
Why Enterprises Choose OX
- One security graph across the entire delivery chain: GitHub repos, CI/CD pipelines, container registries, and AWS/GCP/Azure cloud accounts connected, not siloed.
- PBOM (Pipeline Bill of Materials): tracks every build input, dependency, tool, secret, and CI metadata in real time. Not a point-in-time snapshot, a live, auditable record of everything that shipped.
- Findings traced to the exact repo, file, and commit: the Agentic Pentester continuously simulates real attack paths and pinpoints where in the codebase the risk originated.
- Prioritization based on actual exploitability: not CVE severity scores. Only risks that are reachable and impactful in your environment reach the remediation queue.
- Compliance reporting built in: natively maps to NIST SSDF, SLSA, ISO 27001, SOC 2, and EO 14028 with exportable audit-ready reports.
- Executive and compliance team visibility: posture tracked by team, repo, and pipeline with dashboards exportable for board-level reporting and compliance audits.
Conclusion
Modern AppSec requires more than scanning for CVEs. It demands full visibility across code, cloud, pipelines, and runtime, with controls that scale across teams and environments. Snyk solves part of the problem, but as complexity grows, most teams need more depth, more integration, and tighter alignment with compliance and engineering workflows.
The tools covered here offer that depth in different ways, some with broader coverage, others with sharper focus. The right choice depends on your stack, your risk model, and how tightly you need to integrate security into your SDLC. What matters most is choosing tools that reduce noise, support your workflows, and help you prove control from commit to production.
FAQs
OX Security is the best Snyk alternative. Snyk is strong for developer-first security with SCA, SAST, IaC, and container scanning. But it is still scanner-centric and focused mainly on code and dependencies. OX Security takes a supply chain–first approach. It invented the PBOM to track code lineage from the first commit through build and deployment, ensuring artifacts in production are authentic and untampered. OX also maps real attack paths across code, APIs, workloads, CI/CD, and cloud, cutting down noise by prioritizing only exploitable risks.
Snyk is primarily an SCA (Software Composition Analysis) tool. It also includes some static analysis, but it’s not a full SAST engine. It does not offer DAST.
Snyk supports DevSecOps workflows, especially for developers managing dependencies and containers. But full DevSecOps includes CI/CD security, IaC scanning, compliance alignment, and runtime posture, which typically requires multiple tools.
OX covers a broader range of the supply chain by connecting the dots across code, infrastructure, secrets, containers, CI pipelines, and runtime. With built-in prioritization, OX offers more comprehensive SDLC coverage and deeper insights, making it ideal for teams that need end-to-end visibility and proactive risk management.