
TL;DR
- Secure Velocity is the rate at which an organization ships software that is safe at creation, expressed as the ratio of risk prevented before merge to the time exposed code stays reachable in production – a delivery metric, not a count of unpatched vulnerabilities.
- Vulnerability volumes signal operational paralysis because counting open CVEs tracks scanner noise instead of enterprise safety, while software flaws drive modern breaches.
- AI speed demands new guardrails since high AI adoption is simultaneously associated with both rising release throughput and delivery instability, making agent velocity a critical metric to track.
- MTTR flatters real exposure unless exposure windows are measured from initial code introduction to runtime resolution, including the silent period before a flaw is detected.
- Measurement requires code-to-cloud lineage to bind developer actions directly to cloud runtimes through a single continuous risk model.
The Challenge: Why Classic AppSec Metrics Fail in the Boardroom
For years, security leaders presented boards with operational metrics: open CVE totals, scan coverage, and aggregate MTTR. These numbers quantify the security team’s workload, not business risk. A board does not need an inventory of unpatched bugs; it needs to know whether the company can keep shipping safely.
This disconnect comes at a critical time. The 2026 Verizon Data Breach Investigations Report (DBIR) found that vulnerability exploitation now fuels 31% of breaches, overtaking credential abuse as the leading initial access vector. Simultaneously, DORA’s 2025 report on AI adoption shows that generative coding tools are associated with an increase in both software delivery throughput and software delivery instability.
AI tools flood repositories with code faster than human triage can inspect it. Under these conditions, presenting growing vulnerability backlogs signals operational paralysis. CISOs need a strategic metric that evaluates delivery speed and defensive control together.
This article introduces CISOs and Heads of Engineering to Secure Velocity, discusses its four components, and shows how to instrument and report it.
Core Concepts: What Does Secure Velocity Measure?
Understanding Secure Velocity requires separating operational security activity from strategic delivery performance.
Defining Secure Velocity
Secure Velocity is the rate at which an organization ships software that is safe at creation, expressed as the ratio of risk prevented before merge to the time exposed code stays reachable in production. It measures how effectively an enterprise halts vulnerabilities at the point of creation relative to how long the ones that get through stay exposed.
Secure Velocity is fundamentally distinct from two related concepts:
- Developer Velocity: Measures feature output, commit volume, and release frequency per unit of time – focusing purely on engineering speed regardless of risk.
- Remediation Throughput: Measures the volume of security findings closed per unit of time – focusing on reactive backlog burn-down rather than prevention.
While developer velocity measures how fast code moves and remediation throughput measures how fast teams clean up after the fact, Secure Velocity measures how fast the organization delivers business value without creating defensibility debt.
Defining Evidence-Based Prioritization
Maximizing Secure Velocity depends on evidence-based prioritization: the practice of ranking security work by mathematically demonstrated exploitability and call-path reachability rather than by static CVSS severity alone. Instead of prioritizing a theoretical vulnerability in an unexposed utility library simply because it carries a high CVSS score, evidence-based prioritization isolates flaws that have an open execution route, active entry point, and reachable data sink in the live application context. Evaluating real-world exploitability allows security and engineering teams to eliminate noise and focus remediation strictly on true exposure.
The Components: Prevention Rate, Exposure Window, Fix Velocity, Agent Velocity
Secure Velocity unifies four distinct operational metrics into a single, trendable measurement framework. Rather than tracking raw inventory counts, each component resolves to a precise rate or duration, providing an actionable picture of pipeline health.
#1. Prevention Rate vs. Remediation Rate
Unit: Percentage (%) of total introduced risk
Prevention rate measures the share of security defects, secret leaks, and bad dependencies intercepted before code hits the main repository. Remediation rate measures the percentage of flaws that slip past pre-commit gates and must be fixed post-merge. Tracking the ratio between defects created and defects remediated reveals whether an organization is truly shifting left. A rising remediation rate paired with a stagnant prevention rate indicates a reactive treadmill where teams burn cycles fixing preventable bugs. High Secure Velocity requires driving prevention higher so post-commit triage becomes the rare exception.
#2. Exposure Window
Unit: Total elapsed time (hours or days)
Exposure window replaces traditional mean time to remediate (MTTR) by tracking the exact time elapsed from the moment a vulnerability enters a reachable artifact until that artifact is no longer exposed in production. Standard MTTR begins tracking only when a ticket is opened, entirely excluding the window when a flaw sits undetected in runtime. The exposure window includes this silent exposure time. By holding teams accountable for both detection gaps and deployment delays, it measures true production risk and prevents vulnerable code from sitting exposed behind unmonitored release gates.
#3. Fix Velocity
Unit: Validated remediations closed per thousand lines of shipped code (fixes/KLOC)
Fix velocity measures remediation throughput normalized against the volume of new functional code delivered in the same period. Raw remediation counts are misleading vanity metrics; they naturally inflate whenever an organization hires more engineers or deploys additional scanners. Fix velocity evaluates whether remediation capacity scales alongside overall software delivery output. A dropping fix velocity signals that development output is outpacing security resolution, leading to compound security debt. Normalizing fixes against code velocity ensures that remediation effort is evaluated in proportion to overall business growth.
#4. Agent Velocity
Unit: Code-affecting machine actions per hour (actions/hour)
Agent velocity tracks the volume of autonomous actions (such as AI-generated commits, dependency updates, IaC adjustments, and automated PR merges) executed per unit of time across the development lifecycle. As generative AI assistants and agentic workflows author a growing share of enterprise software, agent velocity serves as the critical denominator for the other three metrics. A surge in agent velocity without a corresponding rise in prevention rate will outpace developer remediation capacity sooner rather than later. Measuring machine-driven change ensures security teams maintain governance over high-speed, agentic software delivery.
How Do You Instrument Secure Velocity in Your SDLC?
Computing Secure Velocity requires collecting telemetry across four distinct layers of the software development lifecycle (SDLC):
- Prevention Rate Telemetry: Originates at the developer interface and AI assistant layer – capturing IDE-level interceptions, prompt-governance blocks, and pre-commit hook enforcement before code reaches the central repository.
- Exposure Window Telemetry: Originates by pairing SCM commit and deployment timestamps with live cloud runtime observability. The exposure window tracks the exact duration between reachable artifact creation and its decommissioning or patching in production.
- Fix Velocity Telemetry: Originates from developer pull-request merges, issue-tracking platforms (such as Jira or GitHub Issues), and pipeline deployment logs.
- Agent Velocity Telemetry: Originates from agentic audit logs, Model Context Protocol (MCP) server telemetry, and CI/CD runner execution traces.
For these four data streams to calculate valid ratios, all underlying events must share a single persistent identifier tied to the specific software artifact. If IDE events, commit SHAs, pipeline jobs, and container image digests exist as isolated records in disparate tools, correlation fails, and Secure Velocity cannot be computed.
Furthermore, evidence-based prioritization provides the mathematical weighting for these calculations. Under this framework, preventing a flaw on an active, internet-exposed call path carries significantly higher weight in the prevention rate calculation than preventing an unexploitable vulnerability in dead code. Weighting metrics by reachability ensures that engineering capacity maps directly to true exposure reduction.
Reporting It: The One-Slide Board View
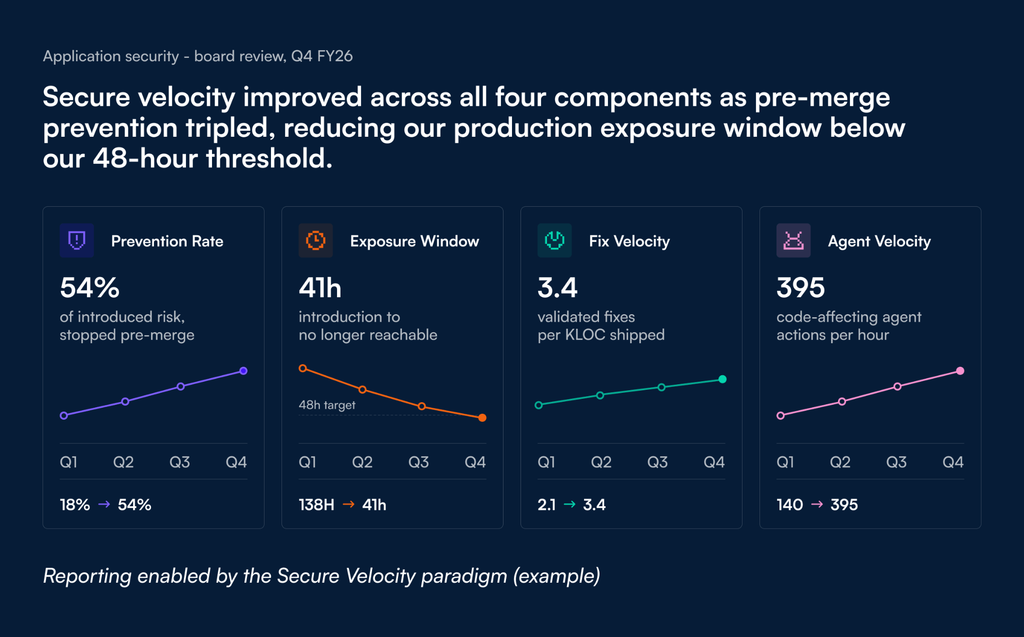
Communicating application security to executive leadership effectively can often mean leaving behind the tactical operational dashboard and collapsing program performance into a single, high-signal slide. The shift is from inventory to direction – not what the security team currently holds, but whether the program is improving and whether it is operating inside the tolerance the business set. That is a claim a board can act on and a team can be held to.
To maintain executive clarity, specific tactical details must be deliberately left off this view:
- No CVSS severity breakdowns (e.g., critical vs. high backlog charts).
- No security tool inventories or vendor scan coverage stats.
- No per-team engineering league tables or public shame boards.
Instead, this view sits inside the broader set of security KPIs that allow a board to evaluate defensive health. By presenting this trended structure, the slide empowers board members to ask two fundamental strategic questions without requiring a follow-up briefing:
- Is our investment in security prevention successfully protecting engineering release speed?
- Does our current production exposure window fall within the risk tolerance threshold approved by the business?
Common Mistakes and Limitations: Where Implementations Fail
Implementing Secure Velocity requires avoiding four common structural failure modes:
- Reporting Prevention Rate Without Agent Velocity: Tracking prevention rate in isolation creates a false sense of security. A drop in introduced risk looks like a defensive victory on paper, but if agent velocity also dropped during a quiet engineering quarter, the lower defect count simply reflects reduced coding activity. Prevention rate must always be evaluated alongside agent velocity to verify that controls are holding under actual development pressure.
- Measuring Exposure Windows from Detection Instead of Introduction: Resetting the exposure clock to start when a scanner or ticket detects a flaw, rather than when the reachable commit entered production, flatters the metric by excluding the exact window when nobody was looking. True risk accumulates from the moment code deploys, regardless of when triage occurs.
- Using Components as Individual Team Scorecards: Transforming Secure Velocity metrics into performance targets for individual engineering squads incentivizes negative behavior. Developers forced to hit arbitrary metrics will suppress finding logs, delay reporting, or push unverified fixes to artificially inflate their numbers rather than focusing on genuine risk reduction.
- Setting Executive Targets Without a Three-Quarter Baseline: Establishing board SLAs before capturing at least three quarters of baseline telemetry creates unmanageable targets. Organizations need historical data across multiple release cycles to understand natural operational variance before committing to hard exposure window or prevention goals.
| Implementation Mistake | Operational Flaw | Strategic Correction |
| Isolated Prevention Tracking | Treats low activity quarters as security wins | Pair prevention rate directly with agent velocity telemetry |
| Detection-Based Timing | Excludes silent undetected periods from MTTR | Measure from initial reachable commit timestamp to production fix |
| Per-Team Scorecards | Drives finding suppression and metric gaming | Measure organizational pipeline health, not individual developers |
| Premature Target Setting | Sets arbitrary SLAs without operational context | Capture a 3-quarter baseline before establishing board targets |
The OX Security Angle: Solving the Measurement Problem
Calculating Secure Velocity is not a reporting challenge – it’s an architectural one. Traditional security stacks rely on siloed scanners operating in isolated lifecycle stages. A standalone SAST tool can count static code defects, an SCA scanner can flag vulnerable dependencies, and a CSPM tool can log misconfigured cloud assets. However, because these tools operate in isolation, none of them can supply the unified denominator required to measure continuous risk across code and runtime. That gap is what moved the category from posture management to an AI-native platform. The OX AINAPP (AI-Native Application Protection Platform) solves this measurement problem by establishing a single risk model that spans from developer prompt to cloud runtime.
Interception at Creation vs. Post-Commit Detection
A true prevention rate cannot be calculated by auditing pull requests long after code has been authored. OX VibeSec intercepts risk at the earliest point of creation: governing developer prompts, AI coding assistants, and MCP integrations directly inside the IDE. Capturing pre-commit blocks alongside repository merges provides the raw inline telemetry required to compute an accurate prevention-to-remediation ratio.
Code-to-Runtime Lineage vs. Disconnected Telemetry
Measuring an accurate exposure window requires visibility into both ends of the deployment lifecycle. OX Cloud pairs runtime signals with security findings across deployed applications, containers, and components, correlated through OX’s AI context lake. When a runtime exposure surfaces, the platform traces the live asset back to the code change and the pipeline run that produced it.
By unifying pre-commit prevention, evidence-based prioritization, and deterministic lineage across the entire delivery chain, OX equips CISOs with the foundational engine needed to measure and drive Secure Velocity across the enterprise.
Shifting From Workload to Defensibility
As software delivery accelerates through generative AI and agentic workflows, traditional vulnerability-count metrics fail to describe enterprise risk. Counting open CVEs, tracking tool coverage, and measuring isolated MTTR quantifies the security team’s manual workload rather than the business’s actual defensive posture.
Secure Velocity replaces finding counts with a strategic defensibility rate: measuring how fast an organization delivers software that is safe at creation against the duration exposed code remains in production.
By joining four core operational components: Prevention Rate, Exposure Window, Fix Velocity, and Agent Velocity, security leaders transform fragmented data into a clear, trendable board metric. Most organizations already generate the raw telemetry required to calculate these ratios across IDEs, SCM commits, CI/CD pipelines, and cloud runtimes. What has been missing is a single continuous risk model to bind them together.
Putting a single continuous risk model behind these four components is what makes them reportable. See how OX measures Secure Velocity.
FAQs
Developer velocity measures output alone – commits, features and releases per unit of time. Secure Velocity measures that same delivery against the exposure it creates, so shipping faster only improves the number when fewer defects reach production.
Standard MTTR only begins tracking time once a ticket is created or a scan detects a vulnerability. This completely excludes the silent exposure window when a flaw sits undetected in production, understating actual business risk.
A drop in introduced risk might look like a security victory on paper, but if agent velocity also dropped, it simply reflects a quiet development period. Pairing both metrics ensures defensive controls are holding under actual coding volume.
Point tools operate in isolation – SAST looks at code, SCA looks at dependencies, and CSPM looks at cloud assets. Because they lack a unified persistent identifier spanning from commit to runtime, they cannot compute the cross-lifecycle ratios required for Secure Velocity.
Organizations should capture at least three quarters of baseline telemetry across IDEs, CI/CD pipelines, and runtime environments before establishing formal board SLAs or target exposure windows.