
TL;DR
- OX Security is best for AppSec, platform, and development teams needing centralized SAST orchestration across CI/CD, repos, and scanners, with strong multi-tool integration and policy control.
- Snyk Code offers fast, developer-friendly SAST with inline PR feedback and easy GitHub/GitLab integration, but lacks on-prem support and deep rule customization.
- Semgrep is lightweight, highly customizable, and ideal for CI pipelines, with YAML-based rules and taint-tracking, though it focuses only on SAST and needs tuning.
- Aikido Security provides all-in-one scanning (SAST, SCA, IaC, secrets) with zero CI config, great for startups and small teams, but less flexible for complex orgs.
- GitLab SAST is fully integrated for GitLab users, offering seamless CI security scans and dashboards, though advanced features require GitLab Ultimate.
- Choice depends on needs:
Use OX for scale, Snyk for speed, Semgrep for control,
Aikido for simplicity, and GitLab SAST if you’re all-in on GitLab.

If you’ve ever tried to scale Static application security testing (SAST) across dozens of repos and multiple teams, you know it’s not as simple as picking a tool and running it in CI. SAST tools are noisy out of the box. Their defaults are opinionated. They don’t always play nice with your pipeline. And unless you’re deliberate about setup, you’ll end up with scans that trigger alerts nobody triages, or worse, scans that break builds with no context and erode trust in the entire program.
In the last couple of years, I’ve seen this problem repeat itself across multiple orgs. Engineering wants speed and autonomy. Security wants coverage and control. Compliance teams show up with checklists, SOC 2, HIPAA, FedRAMP, and expect SAST to be “turned on.” However, unless someone takes ownership and properly integrates these tools into the dev workflow, a gap will be created. And that gap usually ends up being filled by alert fatigue, ignored findings, and last-minute firefights before release.
You don’t need to look far to see how bad it can get. There’s a Reddit thread where a developer shares how SAST became overwhelming due to the constant alerts and lack of clear signals. I’ve heard that same frustration from teams who were handed a tool without any integration guidance, then left to debug it mid-sprint.
What platform and DevSecOps engineers really need is a comprehensive set of application security testing tools including a SAST toolchain that
- Fits into CI/CD without complex rewrites
- Supports GitHub, GitLab, Bitbucket, Azure Repos without hacks
- Offers RBAC, SAML, and multi-tenancy for secure scaling
- Runs in hybrid/on-prem/cloud-native environments
- Supports suppression policies and team-based rulesets
This guide is a breakdown of 10 SAST tools that actually meet those requirements in 2025. Not vendor slides, not security marketing jargon, but real tooling you can install, test, and plug into your pipelines. For each one, I’ll explain how it works, what it does well, where it falls short, and how to get hands-on quickly.
Top 10 Static Application Security Testing Tools
1. OX Security
2. Snyk Code
3. Semgrep
5. Veracode Static Analysis IDE Scan
9. GitLab SAST
10. Arnica.io
If your job involves running secure builds across multiple services, this will save you time.
10 Important Capabilities Every Enterprise SAST Tool Must Have
Not every SAST tool is built with real-world constraints in mind. When you’re responsible for keeping hundreds of services secure without slowing down dev velocity, the tool you choose needs to integrate deeply into your pipeline, speak your stack’s language, and handle complexity without becoming another problem to manage.

1. Deployment Flexibility is Essential
In regulated industries, deployment flexibility is non-negotiable. While SaaS solutions offer convenience and fast onboarding, compliance-heavy environments often demand strict control over data residency and scanning processes. Prioritize tools that support multiple deployment models, SaaS, on-premises, hybrid, and air-gapped, for maximum adaptability.
2. Native CI/CD Integration
Security should enhance your CI/CD pipelines, not complicate them. Choose solutions with out-of-the-box support for GitHub Actions, GitLab CI, Jenkins, Azure Pipelines, and similar systems. The ideal tool should require minimal configuration to scan pull requests, release branches, or tags, and integrate seamlessly with tools like Jira, Slack, or Teams for actionable feedback.
3. Developer-First Experience: IDE & Repo Integration
Adoption hinges on developer experience. Tools that integrate natively with GitHub, GitLab, Bitbucket, or Azure Repos reduce setup friction. Strong IDE support (VS Code, JetBrains, etc.) with inline findings, remediation guidance, and autofix suggestions further streamlines secure coding.
4. Precision Over Noise
High alert volumes without context erode trust. Focus on tools that emphasize accuracy, confidence scoring, and rule customization. Features like issue suppression, severity tuning, and custom rule authoring are critical for prioritizing real risks and avoiding alert fatigue.
5. Full Stack & Infrastructure Coverage
Security can’t stop at application code. Choose a solution that covers the entire stack, from backend and frontend code to infrastructure-as-code (Terraform, CloudFormation), containers (Docker), and orchestration configs (Kubernetes). A fragmented surface creates blind spots.
6. Scalable Access Controls
As teams grow, access must scale with them. Look for support for SAML, SSO, SCIM, and RBAC. Enterprise-ready tools offer repo-level granularity, team-based access, and tenant-level separation, essential for organizations managing multiple teams or GitHub/GitLab orgs.
7. Built-In Compliance Reporting
Meeting regulatory standards like SOC 2, PCI-DSS, HIPAA, or ISO 27001 should be frictionless. Tools should generate audit-ready reports sorted by repo, severity, or compliance framework—and ideally integrate with your GRC/compliance platforms to streamline workflows.
8. Performance at Scale
Modern pipelines demand fast, reliable scans. Your tool should support incremental scans for every commit and full scans for nightly builds, without becoming a bottleneck. Monorepo support and optimized IaC scanning are essential for maintaining SDLC velocity.
9. AI-Aware Security Posture
With AI-assisted coding becoming the norm, tools must be capable of identifying application security vulnerabilities and risky patterns common in LLM-generated code, such as insecure defaults, empty catch blocks, or overly permissive regexes. Proactive detection is critical as AI-generated code becomes a growing attack vector.
10. Predictable, Scalable Licensing
Avoid opaque pricing tied to scan counts, lines of code, or developer seats. Favor licensing models that scale predictably, by team, repo, or organization. Transparent pricing ensures long-term viability and avoids budget overruns as your usage expands.
Once you’ve defined your needs clearly, the next step is to evaluate what tools actually deliver. Here’s a quick side-by-side to help compare what each platform offers before we dive into specific breakdowns.
SAST Tools Comparison Based on Integration, Signal Quality, and Workflow Fit

Before we walk through each tool, here’s a high-level comparison for platform teams trying to narrow down choices quickly. This table doesn’t try to list every feature; it focuses on what matters during actual implementation: deployment models, integration ease, dev experience, and policy control.
| Tool | Deployment | IDE Support | CI/CD Integration | False Positives Control | Policy Customization | Compliance-Ready |
| OX Security | SaaS / Hybrid | VS Code, JetBrains (via tools) | GitHub, GitLab, Jenkins, Azure | Strong filtering, ruleset tuning | Yes (GraphQL-based filters) | Yes |
| Snyk Code | SaaS | Strong (VS Code, JetBrains) | GitHub, GitLab, Bitbucket | Strong (AI engine, low false‑positive rate | Yes (consistently ignore rules) | Yes |
| Semgrep | SaaS / Self-hosted | VS Code, JetBrains | GitHub Actions, Jenkins, GitLab CI | Strong (AI filtering, autofix | Yes (custom & Pro rules) | Yes |
| SonarQube/Cloud | On-prem / SaaS | VS Code, IntelliJ | Broad CI/CD support | Mixed, depends on rules | Moderate | Yes |
| AppScan CodeSweep | SaaS / Plugin | VS Code only | Manual, pre‑commit, GitHub action | Basic | No | No |
| Aikido Security | SaaS | Visual Studio Code, JetBrains | CI/CD, IaC pipeline support | Basic noise filter from AppScan Cloud | Yes: policy reports, compliance mapping | Yes |
| Corgea AutoFix | SaaS | VS Code, Windsurf | GitHub App | AI-powered triage | Limited | No |
| GitLab SAST | Built-in (GitLab) | GitLab Web IDE | Auto-configured in GitLab CI | OK with tuning | Yes (ruleset YAML) | Yes (self-managed) |
| Bandit | CLI (local) | Any (via CLI) | GitHub Actions, Jenkins (manual) | Manual tuning needed | Limited | No |
| Qodo CLI | CLI / npm package | Terminal-focused | CI/CD via CLI or custom hooks | High (custom agents) | Strong via config | Depends on usage |
Now, we’ll break down each tool individually, how it works, where it fits best, and what kind of environments it’s suited for. Starting with OX Security, a platform-first solution aimed at large-scale, multi-signal security orchestration.
1. OX Security (OX VibeSec, OX Code, OX Cloud, OX Agentic Pentester)
OX Security brings SAST into a single, connected workflow. Its PBOM (Pipeline Bill of Materials) pulls results from tools like Semgrep and Checkmarx into one view, linking code issues with dependencies and pipeline changes so teams can see where risk started and what to fix first, with VibeSec catching issues earlier in development.
Where tools like Checkmarx and SonarQube flag a vulnerable dependency in source code and stop there, OX checks whether that dependency is actually loaded at runtime and reachable from an external endpoint, using its Code Projection technology.
For teams using AI coding tools such as Cursor and Copilot, VibeSec enforces security policies inside the coding assistant before code is committed. The Agentic Pentester then continuously simulates attack techniques and traces every exploitable finding back to the specific file, and commits a change.
Key Features
- VibeSec: Intercepts code generation inside AI coding assistants, the IDE-based editor Cursor, and the in-editor assistant GitHub Copilot, at the prompt stage, injecting security policies and context before code is produced.
- Code: Covers SAST, SCA, secrets, IaC, and CI/CD posture, using Code Projection to prioritize findings based on reachability, exploitability, and business impact.
- Cloud: Connects code-level findings to runtime by showing which libraries and components are actually active, and tracing exposures back to their source in code.
- Agentic Pentester: Runs continuous attack simulations and maps each confirmed issue to the exact repository, file, and commit responsible.
- PBOM (Pipeline Bill of Materials): Tracks components, dependencies, and pipeline changes in real time, linking findings across the SDLC.
- Integrations: Supports 100+ integrations, including GitHub, GitLab, Jenkins, Checkmarx, Snyk, Docker Hub, AWS, and GCP.
Installation
You start by connecting your Git provider (GitHub, GitLab) via the OX dashboard. From there, it auto-discovers your repos and CI pipelines. Adding connectors like Jenkins or Docker Hub just takes a token. The default SAST tools are preconfigured; you can disable or layer in others based on what you already use.
Hands-on Example: Running Meta’s Llama 3 on AWS Bedrock
I was running an AI pipeline where each service interacts with AWS Bedrock via Lambda in which had a repo for one of our AWS Bedrock Lambda services, specifically, the one calling Meta’s Llama3 8B via Python. It’s Terraform-managed, ties into Bedrock through IAM, and exposes an optional function URL for internal inference testing.
When I hooked it into OX, one of the first things it flagged wasn’t even in the Lambda code; it was that the repo was public and missing a SECURITY.md. Now, normally, this isn’t something I’d catch in a regular scan because I’m focused on the runtime and permissions. But OX marked it as a medium-severity issue under “Git Posture.”
The context made sense: if someone spots a vuln and there’s no clear disclosure path, they might just drop it publicly. That repo interacts with Bedrock and handles model output; I really don’t want that kind of exposure.
Here’s what I saw:

What I appreciated: OX didn’t just dump a warning. It showed exactly which repo was affected, who owned it, and gave me direct paths where to drop the missing file, /root, .github, or /docs. I added the policy in .github/SECURITY.md, committed it, and OX cleared the issue automatically in the next scan. That kind of signal, focused, actionable, no noise, makes SAST actually usable in a CI/CD loop.
Pros
- Unified interface across all security signals without replacing existing tools
- Strong hybrid/on-prem/cloud-native support
- Granular filters and tagging to scale across teams
- Surfaces findings directly in PRs and IDEs with simple explanations
- Code-level fixes suggested based on your specific codebase
Cons
- Establishing a high-fidelity PBOM requires thoughtful initial alignment of security policies to move beyond the noise of traditional scanners

2. Snyk Code

Snyk Code is what I usually reach for when I need developer-first static analysis baked directly into GitHub or GitLab workflows. It’s not just another scanner; it’s tuned for speed, integrates naturally into SaaS pipelines, and gives just enough context to keep things moving without killing velocity.
This tool isn’t trying to be everything for everyone. It focuses on the dev loop, with a particular strength in onboarding security into CI/CD workflows early. You don’t need to write complex configs or wire up external scanners. It connects via the GitHub App or CLI, and you’re up and running within minutes.
Key Features
- Native GitHub/GitLab integration for repo-level scanning
- Combined SCA + SAST view from a single UI
- PR-level annotations with in-line security feedback
- Policies and ignore rules per project or org
- CLI for local or CI use, with snyk code test or snyk code monitor
Installation
For GitHub-based projects, install the Snyk GitHub App and enable Snyk Code scanning at the org or repo level.
Hands-on Example: Catching a Code Injection
While working on a payments API for a side project, I ran a quick snyk code test scan before merging my changes. The tool flagged a high-priority code injection vulnerability in one of the routes, specifically around a poorly handled eval() statement in transactions.js.
The function was logging incoming payment data like amount and card number using string interpolation inside eval(). It looked harmless at first glance, but since the input came directly from the HTTP request body, it introduced a vector for remote code execution. This is the kind of issue that easily slips into a rushed commit and gets missed in a basic code review.
Snyk didn’t just highlight the line; it gave me a full data flow trace from the HTTP request into the vulnerable statement and explained exactly how the payload could be exploited. I swapped out eval() for a safer logging mechanism and re-scanned, issue resolved, no guesswork.

You can refer to the snapshot to see how the vulnerability was flagged inline with severity score, CWE context, and direct file location. It’s exactly the kind of tight loop you want during PR review: fast feedback, clear remediation path, and no need to leave the IDE or GitHub.
Pros
- Easy onboarding with GitHub/GitLab
- Clear UX for developers
- Combines SAST with SCA in one place
- Supports org-wide policies and rulesets
Cons
- Usage-based pricing adds up fast for bigger orgs
- No on-prem version, cloud-only
- Rule customization is limited compared to Semgrep
3. Semgrep

Semgrep is one of the few tools I consistently recommend when teams want speed, customization, and rule control without compromising dev workflow. It’s a rule-based static analyzer, built with both open-source and enterprise use in mind. The power lies in how lightweight it is and how easy it is to customize; you write rules like you write code. If you’re running scans in CI or want IDE feedback without a heavyweight backend, Semgrep is a strong pick.
It supports over 30+ languages, works with GitHub, GitLab, Bitbucket, and can run fully local or as a managed service via Semgrep Cloud Platform.
Key Features
- Native support for custom and community-contributed rules
- Open-source CLI, with enterprise policies and dashboards via Semgrep Cloud
- GitHub PR annotations, GitLab MR comments, Bitbucket pipelines supported
- Rule registry with OWASP Top 10 and popular vuln patterns
- Real-time IDE support via JetBrains plugin and VS Code extension
Installation
Semgrep installs like any dev tool:
# install through homebrew
brew install semgrep
# install through pip
python3 -m pip install semgrep
# confirm installation succeeded by printing the currently installed version
semgrep --version
It plugs right into CI tools like GitHub Actions, GitLab CI, CircleCI, and Jenkins.
Hands-on Example: Unsafe Eval Flagging
I ran Semgrep against a Node.js payment API, a typical Express-based microservice. One of the issues that surfaced immediately was input flowing directly into eval(). The code-string-concat rule flagged this under high severity with high confidence, and for good reason. In the route handler inside src/routes/transactions.js, the code looked like this:
eval(`console.log(“Transaction received: Amount = ${amount}, Card Number = ${cardNumber}”)`);
This is problematic. Both amount and cardNumber are coming straight from req.body, and passing that directly into eval() means untrusted data is being executed as JavaScript. That’s textbook code injection. What helped here was Semgrep’s taint-tracking. It traced the source at line 7 (request body) to the sink at line 17 (eval), and visualized that path clearly in the UI.

To fix this, I rewrote the line to avoid dynamic string evaluation. No more eval, no more risk. The logging still works, but it’s structured and safe. Static detection like this, clean, precise, flow-aware, is what makes it one of the few SAST tools I actually trust in CI.
Pros
- Fast and lightweight for CI/CD use.
- Easy to write custom rules in YAML.
- Open source and transparent scanning.
Cons
- Needs tuning to reduce false positives.
- Focused only on SAST, no support for secrets or IaC.
4. SonarQube

SonarQube (self-hosted) and SonarCloud (SaaS) are code quality and security analysis tools that sit at the intersection of SAST and static linting. They’re often used by teams looking to cover both tech debt and OWASP risks in one scan. The platform supports a wide range of languages and has solid visual dashboards for tracking code health over time.
Key Features
- Built-in support for OWASP Top 10 and CWE classifications.
- Tech debt measurement, code smells, and maintainability tracking.
- Deep integration with GitHub, GitLab, Azure DevOps, and Bitbucket.
- IDE support via plugins (IntelliJ, VS Code).
- Branch-based scanning and quality gates.
Installation
- SonarQube: Docker container or self-managed deployment.
- SonarCloud: Cloud-based, integrates directly with repo hosts via OAuth.
Hands-on example: Unsafe Logging Patterns
After setting up SonarQube to scan a Java-based microservice (log4shell-vulnerable-app), the scanner flagged a high-severity vulnerability related to unsafe logging of user-controlled data.
Here’s the relevant snippet SonarQube flagged:
@GetMapping("/")
public String index(@RequestHeader("X-Api-Version") String apiVersion) {
    logger.info("Received a request for API version " + apiVersion);
    return "Hello, world!";
}
The issue? The apiVersion header is user-supplied and directly concatenated into a log message. SonarQube correctly marked this as a security vulnerability, it’s the kind of pattern that’s vulnerable to log injection and in some cases, JNDI injection (think Log4Shell-style attacks if unresolved).
Pros
- Detects security vulnerabilities and code smells across multiple languages.
- Integrates with most CI/CD pipelines and SCMs out of the box.
- Enforces quality gates to block non-compliant code merges.
- Developer-focused UI with IDE support and contextual feedback.
- Supports OWASP, CWE, and other compliance standards.
Cons
- False positives require manual triage and tuning.
- High resource usage on large monorepos or legacy codebases.
- Configuring custom rules and quality profiles takes time.
5. Veracode Static Analysis IDE Scan

Veracode Static Analysis IDE Scan is a lightweight, dev-friendly static analysis tool designed to catch vulnerabilities early, right within your IDE. Unlike heavyweight SAST platforms that require extensive CI/CD setup, this tool integrates directly with IDEs like VS Code and IntelliJ, offering fast feedback with minimal friction. It’s part of Veracode’s broader AppSec platform but is tailored for developers looking for instant security insight during local development.
Key Features
- Native integration with popular IDEs like VS Code, IntelliJ, and Eclipse
- Supports Java, JavaScript, Python, TypeScript, C#, and more
- Provides inline remediation guidance and issue descriptions
- Runs scans on save or via manual trigger
- Requires minimal setup, just sign in with your Veracode account
Installation
Install from your IDE’s marketplace by searching for Veracode Static Analysis IDE Scan. Once installed, authenticate with your Veracode credentials. The extension will activate automatically when the code is opened or modified.
Hands-on example: SQL Injection in Blog Feature
In this example below, a simple blog post submission feature is being built. The SQL query is constructed using untrusted user input directly, leading to a SQL Injection vulnerability.

Veracode flags this with a High severity finding (CWE-89: Improper Neutralization of Special Elements in SQL Commands). The vulnerability is visible directly in the IDE, with details on:
- The file and exact line of the flaw
- Taint sources and data flow paths
- Suggested remediation steps and references
Pros
- Accurate Results: Low false positives (<1.1%) reduce noise for developers.
- Broad Coverage: Supports many languages, frameworks, and compliance standards.
- Developer-Friendly: Integrates into IDEs and CI pipelines with fix guidance.
- Scalable SaaS: Handles large codebases without infrastructure overhead.
Cons
- Slower Scans: Full scans can delay fast-moving dev cycles.
- Cloud Dependency: No on-premise option; code upload may raise security concerns.
- Cost: Pricing can be steep for small teams or startups.
6. Aikido Security

Aikido is a security automation platform that bundles together multiple types of scanners, including SAST, SCA, IaC, secrets, and container scanning, into a single Git-integrated workflow. The goal is to provide baseline security coverage without needing separate tools for each part of the stack. It’s especially suited for early-stage teams or orgs that want security checks baked into development, without building complex pipelines from scratch.
Aikido primarily integrates with GitHub and GitLab, offering commit and PR-based scanning. Once connected, it starts scanning repositories automatically, no custom CI config or YAML jobs needed.
Key Features
- All-in-One Scanning: Combines static code analysis (SAST), dependency scanning (SCA), IaC misconfig detection, and secret scanning in one place.
- PR-based Feedback: Flags issues inline on pull requests and commits with contextual info.
- AI-Powered De-duplication: Uses heuristics to reduce noise and collapse repeat findings.
- Autofix (in preview): Generates suggested code fixes as pull requests.
- Compliance Templates: Maps findings to controls from SOC 2, PCI, and HIPAA frameworks.
- Prebuilt GitHub Integration: No additional CI scripts or YAML configuration needed.
Hands-On Example: Secrets and SCA Findings
After connecting my GitHub organization to Aikido, the onboarding was dead simple , no agent installs, no YAML edits. I authorized access, selected the repos, and clicked “Start Scan.” Within seconds, the dashboard populated with findings across multiple security domains: SAST, SCA, and Secrets.
In my payment-api repo, Aikido flagged a high-severity hardcoded secret and a vulnerable dependency, and grouped both under a clear risk summary. The scan also covered our Python tool (PHARE) and Terraform infra (svc-prod) without extra configuration. What stood out was how clean and uncluttered the UI was:

No false sense of security, no noise. Everything was triaged with severity tags and linked to remediation steps. What I appreciated most was how fast it ran and how little I had to configure to get value. It’s the kind of tool you can plug into an early-stage startup stack and have baseline visibility within a few minutes.
Pros:
- No CI setup needed, GitHub-based scanning starts instantly
- Covers multiple scan types without juggling tools
- Inline PR comments reduce developer context-switching
- Noise reduction filters out non-critical issues
- Autofix PRs speed up resolution in basic cases
Cons:
- Feature depth is limited compared to dedicated SAST tools
- REST API and custom reporting are still evolving
- UI can feel cluttered due to many integrated functions
- Pricing jump after free tier may be steep for small teams
- Relies on OSS tools like Semgrep and Trivy under the hood
7. Corgea AutoFix

Corgea AutoFix focuses on one thing: automated code fixes for security issues. Instead of just surfacing findings like a traditional SAST tool, it tries to patch them, usually by opening a pull request with proposed changes.
It connects directly to GitHub, GitLab, or Bitbucket. Once connected, it scans your repositories, identifies security issues (like hardcoded secrets, injection risks, or overly permissive IAM policies), and suggests changes using AI. These suggestions show up as standard PRs, no need for a separate dashboard or UI.
Behind the scenes, it combines static analysis with large language models. The idea is to catch common issues like insecure patterns and also reason through more complex flaws, like broken access logic or misconfigured infrastructure code. You can choose to accept, edit, or ignore its suggestions; it doesn’t auto-merge anything by default.
Hands-on Example: Ownership Check on User Route
After connecting a Node.js backend repo to Corgea, it flagged an insecure authorization pattern. Specifically, it detected that the /users/:userId endpoint allowed access to any user’s data as long as the requester was authenticated, but without checking if the user had permission to access that specific userId.
Corgea identified that the authenticate middleware only verifies the presence and validity of a token, not whether the authenticated user is authorized to fetch another user’s data. The tool highlighted the issue, referencing CWE-284 (Improper Access Control), and provided a proposed fix via a pull request. The PR included an explanation and a fix that involved adding a check to ensure the req.user.id matched the requested userId.

This type of logic bug is often missed by generic linters or SAST tools unless explicitly configured, but Corgea was able to flag it out of the box and suggest a usable patch.
Key Features:
- Git-based Workflow: You review fixes through regular pull requests, no need to switch tools.
- Auto-Fixes Common Issues: Works best on secrets, risky patterns, and config problems.
- Supports External SAST Input: Can plug into other scanners (e.g., Semgrep or Checkov) to act as a fix engine.
- Local Dev Support: Plugins are available for Visual Studio and VS Code if you want to review findings inside the editor.
- Policy-as-Code (in plain English): You can define scanning policies in natural language, which gets converted into enforcement logic.
Pros
- Auto-fixes save time during review cycles
- Works well in GitHub/GitLab PR workflows
- Can handle basic and some complex security issues
- Doesn’t force a new dashboard or portal
Cons
- Fix suggestions still need developer review
- Limited support for custom security rules
- May not catch every issue, best used with other scanners
8. Bandit

Bandit is a lightweight static analysis tool specifically built for Python codebases. It scans source files by parsing their abstract syntax trees (ASTs), looking for security issues based on a predefined set of checks. It’s useful in early-stage CI pipelines, quick local scans, or as a part of broader code hygiene efforts. While it’s not a catch-all solution, it’s a reliable first layer for Python-specific vulnerabilities.
Key Features
- Python-aware scanning
Bandit is purpose-built for Python, so its checks are tailored to the language’s quirks and common pitfalls. - AST-based detection
Instead of relying on pattern matching, Bandit builds and analyzes the AST of each Python file. This helps it detect vulnerabilities that are tied to how the code is structured. - Covers common security issues
It flags:- Hard-coded secrets (e.g., API keys, tokens)
- Unsafe subprocess usage (subprocess, os.popen)
- Insecure use of cryptographic functions
- Use of insecure or deprecated libraries
- File permission and access control misconfigurations
- Unvalidated user input passed into OS-level commands or file operations
- Integrates into CI: It’s CLI-based and easy to wire into CI pipelines for automated, fast feedback.
Hands-on Example: Unsafe yaml.load() in Lambda Function
To test Bandit on a small Lambda function that parses YAML from an event payload, I ran:
bandit “C:\Users\Dell\bedrock-lambda\lambda\handler.py”

As shown in the above snapshot, Bandit flagged two issues:
- Unsafe YAML loading (yaml.load)
At line 15, the code uses yaml.load() with a generic loader. This can deserialize arbitrary Python objects if exploited, which is a common misconfiguration. Bandit recommended switching to yaml.safe_load() to limit this risk. - Use of assert in production code
At line 16, an assert statement was used to check for None. Since assert can be stripped when Python is run with optimizations, it’s unreliable for runtime checks.
These are subtle, easy-to-miss issues, especially in small utilities or Lambdas that don’t go through full reviews. Bandit made them immediately visible with severity and confidence levels.
Pros
- Simple and fast for Python projects
- Low setup overhead, installable via pip
- Good baseline coverage for common Python security issues
- Works well in local dev and CI pipelines
- Open source and widely used in the Python community
Cons
- Python-only, while it doesn’t work for polyglot codebases
- Doesn’t detect runtime or logic-based vulnerabilities
- Can produce false positives in some contexts
- Rules may require tuning to reduce noise on large or legacy codebases
9. GitLab SAST

GitLab SAST (Static Application Security Testing) is GitLab’s native tool for scanning source code within the CI/CD pipeline. Integrated tightly into the GitLab DevSecOps platform, it catches security vulnerabilities early in the SDLC, before they reach production. SAST runs automatically during each pipeline execution, helping teams adopt shift-left security practices.
Key Features: Auto-configured for GitLab CI/CD
- Analyzer-based scanning: Detects programming languages used and applies specialized analyzers accordingly.
- Automatic pipeline integration: Triggers scans on each commit, merge request, or scheduled pipeline without disrupting dev workflows.
- IDE integration: Helps developers identify and remediate issues directly within their tools.
- AI support via GitLab Duo: Provides natural language explanations, exploit examples, and fix suggestions using GitLab’s enterprise AI features.
Installation: GitLab pipeline inclusion
You can enable SAST scanning with minimal configuration.
Option 1: .gitlab-ci.yml template:
include:
– template: Security/SAST.gitlab-ci.yml
Option 2 GitLab UI: Navigate to your project → Security & Compliance → Configuration → Enable SAST. Once configured, scans run automatically on every push or merge request.
Hands-on Example: Vulnerability Report Dashboard
Once GitLab SAST is integrated into your .gitlab-ci.yml pipeline, all detected vulnerabilities are automatically collected and visualized in the Security & Compliance → Vulnerability Report section of your project. This dashboard provides an aggregated view of vulnerabilities detected across your default branch.
In the screenshot below, you can see that GitLab has surfaced multiple issues across various severity levels:

Each finding is categorized by:
- Severity (Critical, High, Medium, Low, etc.)
- Status (Needs Triage, Confirmed, Dismissed, Resolved)
- Tool used (e.g., SAST, Dependency Scanning, Secret Detection)
- File and location (e.g., pom.xml)
- CVE identifier and CWE references
In this example, GitLab Dependency Scanning has flagged:
- A critical vulnerability in org.springframework:spring-web due to unsafe deserialization (CVE-2016-1000027)
- Two high-severity issues in com.fasterxml.jackson.databind (CVE-2022-42004, CVE-2022-42003)
You can triage these directly from the UI, assign them to developers, or use the Security Approval Rules to block merges until they’re resolved. GitLab also allows exporting the report for audit or compliance purposes and supports integration with issue tracking systems for structured remediation workflows. This centralized view enables teams to prioritize, investigate, and fix issues early, without needing external scanners or dashboards.
Pros
- Deep integration into GitLab CI/CD, merge requests, and dashboards
- No need for separate setup or third-party tooling
- Ideal for teams already using GitLab for source control and pipelines
- Supports automated compliance reporting
- Advanced SAST offers deeper code insight with reduced false positives
Cons
- Full feature set, including Advanced SAST and security dashboards, requires GitLab Ultimate
- False positives can still occur, especially in non-Ultimate versions
- Limited runtime context, can’t detect dynamic or environment-specific vulnerabilities
- Deep scans can slow down pipelines for large codebases
- New users may face a learning curve around analyzer configuration and result triage
10. Arnica.io

Arnica is a cloud-native Application Security Posture Management (ASPM) platform built for modern development workflows. Unlike traditional AppSec tools that rely on CI/CD or IDE plugins, Arnica delivers real-time security insights without requiring any changes to your pipeline. It integrates directly with your version control system (e.g., GitHub, GitLab, Bitbucket) and collaboration tools (Slack, Teams, Jira) to provide frictionless, developer-friendly security.
Key Features
- Pipelineless Scanning: Monitors every branch, commit, and pull request automatically, no CI integration or manual triggers required.
- Unified Risk Coverage: Scans for SAST, SCA, IaC misconfigurations, secrets, SBOM violations, license risks, and dependency hygiene, all in one platform.
- Developer-Native Feedback: Delivers alerts directly in PRs, Slack, or Teams, with contextual remediation tips and sometimes one-click fixes.
- AI-Powered Risk Prioritization: Combines CVSS, EPSS, KEV, and org context to help teams focus on exploitable, high-risk issues first.
- Policy Enforcement: Auto-block PRs or branches based on severity, age of risk, contributor behavior, or other custom policy gates.
Installation
Install Arnica from the GitHub Marketplace or via direct integrations with GitLab, Bitbucket, or Azure DevOps. Once connected, Arnica begins scanning your repositories and branches immediately, with no configuration files, no CI pipelines, and no IDE plugins required.
Hands-on example: Pipelineless Security Dashboard
Arnica’s pipelineless risk dashboard offers a centralized view of your entire software supply chain, without needing to manually trigger scans or write custom dashboards. The UI is purpose-built for fast triage, actionable prioritization, and developer-friendly remediation.

In the above UI dashboard, you can quickly assess your organization’s security posture across multiple products and repositories. The Risk Breakdown chart categorizes issues by type, Secrets, SAST, SCA, IaC, License, and Reputation, while also highlighting their severity using a color-coded system (e.g., red for critical). Next to it, the Risk Trends graph (top center) shows how risks evolve over time across different products and statuses, making it easy to track regressions or improvements after fixes or new deployments.
Pros
- Zero Setup: No pipeline or IDE configuration needed—just install and go.
- Comprehensive Visibility: Covers SAST, SCA, IaC, secrets, licenses, and SBOM in one tool.
- Developer-Centric: Real-time PR comments, Slack alerts, and fix suggestions reduce friction.
- Low False Positives: Uses taint analysis and commit context to reduce noise.
Cons
- Limited Customization: Fine-tuning rules or scanning logic is still evolving.
- Cloud Focus: Some cloud infrastructure integrations are still limited.
- Premium Features Gated: Full functionality (e.g., auto-remediation, compliance reporting) is behind paid plans.
- UX Polish Needed: Some users report clunky UI flows during triage or risk filtering.
SAST Implementation Tips
Successfully rolling out SAST means getting the basics right, tight alignment between security goals and developer workflows.
1. Define your goals upfront
Clarify compliance targets (e.g., SOC 2, HIPAA, PCI) and define what counts as a critical issue in your environment. Audit your stack, languages, frameworks, CI/CD setup, and standardize severity levels and SLAs. This avoids confusion when triaging scan results across teams.
2. Pick tools that match your workflow
Choose tools that natively support your languages and plug directly into your CI/CD and IDEs. Integration quality matters more than feature lists. Focus on developer experience, alerts should be specific, actionable, and low on noise. Ensure the tool can scale without slowing builds or needing constant tuning.
3. Start small and scale intentionally
Run a pilot with a willing team and a real repo. Use it to evaluate accuracy, rule quality, and CI integration. Tune thresholds before wider rollout. Implement PR-level scans for fast feedback and push-level scans for policy enforcement. Use scheduled scans for deeper coverage where needed.
4. Handle access, auth, and reporting early
Set up SSO (SAML/OAuth2) and RBAC from day one. Limit config access to security and platform teams. Plug alerts into Slack and Jira, don’t rely on email. Build dashboards to track scan health, remediation velocity, and SLA breaches.
5. Establish a clean baseline
Run a full scan, tag existing issues as baseline, and only block new findings. This keeps developers focused and avoids alert overload. Link fixes to internal playbooks or built-in remediation guidance where possible.
6. Support developers, don’t blindside them
Deploy IDE plugins like Semgrep, Snyk, or AppScan CodeSweep so developers catch issues early. Document common false positives and how to suppress them cleanly. Provide short training and keep a feedback loop with dev teams to refine rules over time.
Once you’ve got developers onboard and your scanning pipeline tuned, the next challenge is scale, especially for platform and DevSecOps teams managing multiple repos, tools, and workflows. This is where orchestration becomes critical. You need visibility across all scan types, enforcement that doesn’t break pipelines, and automation that doesn’t add overhead. That’s where OX Security fits in.
How OX Security Helps Platform Teams
Platform teams running security across multiple repos, CI/CD pipelines, and cloud environments typically end up managing findings from several disconnected tools, each with its own dashboard, alert format, and severity scoring.
The result is that security teams spend more time correlating data across tools than actually fixing vulnerable dependencies, misconfigured pipelines, or exposed secrets.
Pulls in results from your existing scanners
If your team is already running Semgrep, Bandit, or Checkov, OX doesn’t replace them. It ingests their findings alongside results from tools like Checkmarx, Veracode, and Snyk, and correlates everything against your CI/CD pipeline metadata and cloud configuration. Security teams get a single view without having to context switch between tools.
Looking at the Connectors page below:
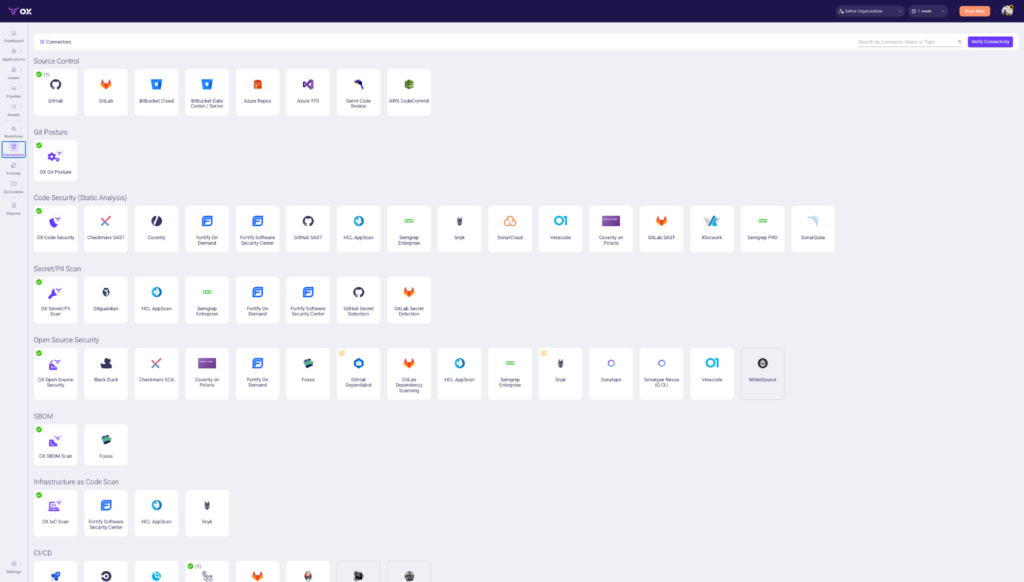
The Connectors page shows the full range of tools OX integrates with out of the box:
- Source Control: GitHub, GitLab, Bitbucket, Azure Repos
- Code Security: Checkmarx, Coverity, Semgrep, SonarQube, Veracode
- Secret/PII Scan: Gitguardian, GitHub Secret Detection, GitLab Secret Detection
- Open Source Security: Black Duck, Snyk, WhiteSource, Sonatype
- SBOM: Fossa
- Infrastructure as Code: Fortify, HCL AppScan, Snyk
- CI/CD Integrations: Jenkins, CircleCI, GitLab CI, and others
If your team is already using any of these, OX picks up their findings automatically without requiring you to change your existing setup.
Identifies what’s actually exploitable
Most scanners flag vulnerabilities based on CVSS score alone, with no context around whether the issue exists in code that actually runs in your environment. OX uses Code Projection to validate exploitability before surfacing a finding, so platform teams are only looking at vulnerabilities that pose real risk.
Handles AI-generated code risk
With AI coding tools such as Cursor and Copilot now standard across engineering teams, vulnerable code is being introduced faster than post-commit scanners can keep up with.
VibeSec enforces your organization’s security policies inside the coding assistant before code is committed, catching the problem at the source rather than downstream in CI.
Continuous runtime validation
The Agentic Pentester continuously simulates real attack techniques against your applications and traces every exploitable finding back to the specific file, commit, and developer responsible, replacing the need for periodic manual pentests with continuous, automated validation.
Scales across teams without losing visibility
OX’s role-based access control and per-team scoping let platform teams delegate security ownership to individual dev teams while maintaining global visibility. Dev teams see findings relevant to their repos. Security and platform teams see everything across the organization.
Conclusion
Choosing the right SAST tool isn’t about features, it’s about fit. The best tools integrate cleanly with your stack, give actionable results without noise, and support the way your developers work. You want something that scales across teams, enforces real policies, and doesn’t need babysitting.
Start with your workflow, not the vendor checklist. Look at where the tool runs (IDE, PR, CI), how it alerts, how it integrates, and how it helps devs fix issues, not just find them. Tools like OX Security stand out because they make it easier to operationalize multiple scanners across repos and teams while keeping everything connected through one control plane.
Pick something that supports where you are now but won’t break when your codebase triples. Build feedback loops, tune policies, and keep developers in the loop. That’s how you make SAST actually work.